Figure 2.

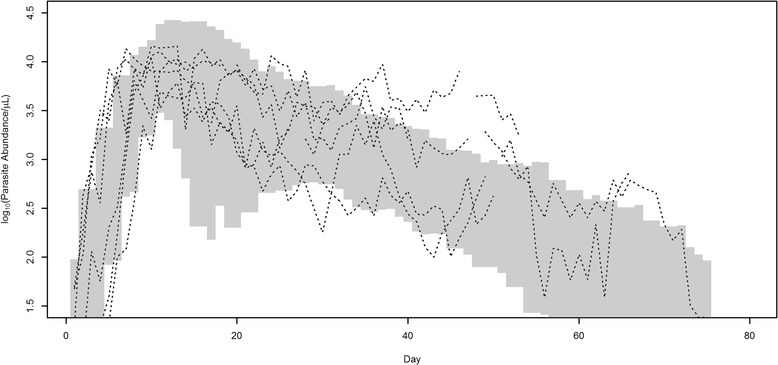
95% confidence intervals for simulated P. vivax log ( parasitaemia) produced by the fitted model. Dotted lines represent the six digitized time series (drawn from McKenzie et. al. [21]) used to fit the model.

95% confidence intervals for simulated P. vivax log ( parasitaemia) produced by the fitted model. Dotted lines represent the six digitized time series (drawn from McKenzie et. al. [21]) used to fit the model.