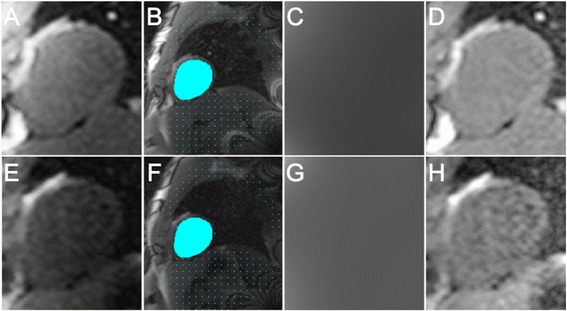
Figure 1.

Process of surface coil intensity correction (SCIC). The original proton density (PD)-weighted image is displayed in (A) and the original first saturation prepared steady-state free precession (SSFP) image from the same subject is displayed in (E), zoomed to focus on the heart. Myocardial (blue mask) and body (blue dots) regions of interest were manually drawn on the proton density image (B) or the first saturation prepared SSFP image (F). The body region of interest was drawn such that it excluded regions with signal intensities that were markedly higher (e.g. fat) or lower (e.g. lungs) than myocardial signal intensity. Surface coil-related field inhomogeneity was then approximated using a third-order surface fit to myocardial and body signal intensities in the PD or SSFP images in order to generate an intensity bias field (C and G respectively). This was subsequently applied to the perfusion image series. The corrected PD and SSFP images are displayed in D and H respectively. The coefficient of variation of myocardial signal intensities (blue mask) for the corrected PD and SSFP images (i.e. D and H respectively) were compared (see Results).
