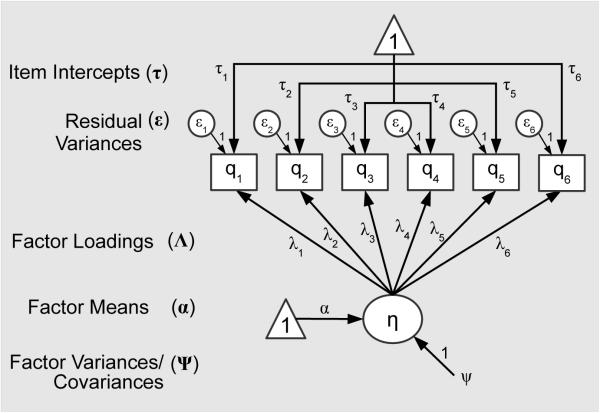
Figure 1.
A graphical depiction of the common factor model.
Note. This figure largely follows the reticular action model notation (McArdle & McDonald, 1984), whereby latent variables are denoted by circles and observed variables are denoted by rectangles. Triangles containing the number one denote the inclusion of mean/intercept structure in the model for the variables pointed to by the path arrows.

