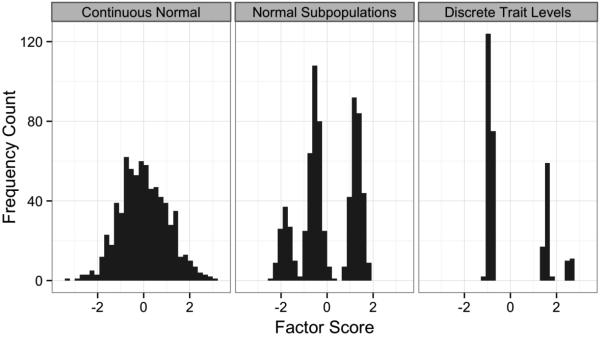
Figure 3.
Latent trait distributions for continuous normal, semi-parametric, and non-parametric factor models.
Note. Data were simulated from unidimensional factor mixture models with 1) a single normal trait distribution representing the population (left panel); 2) three normal subpopulations representing latent subgroups with unique factor means and variances; and 3) three discrete subpopulations representing latent subgroups differing only in latent means. All data were then analyzed using a unidimensional confirmatory factor analysis model, and the resulting factor scores were plotted to illustrate relevant variations in latent structure.

