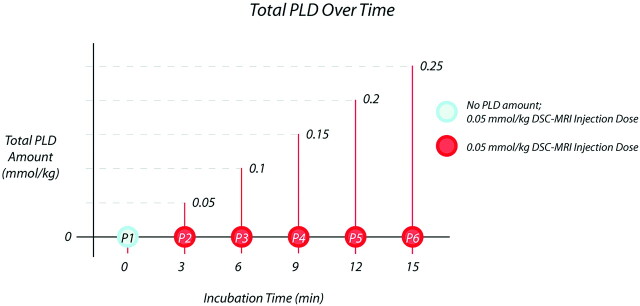
Fig 1.
Diagram demonstrates the step-wise preload dosing (PLD) protocol. Circles depict the 6 sequential dynamic susceptibility-weighted contrast-enhanced (DSC)-acquisition 0.05-mmol/kg contrast injections, each separated by 3 minutes. Relative cerebral blood volume (rCBV) was calculated from each DSC acquisition. The PLD amount for each acquisition (ie, P2 through P6) equals the sum of all preceding contrast-injection amounts. The blue circle (P1) represents the control DSC acquisition with no PLD amount. MRI indicates MR imaging.

