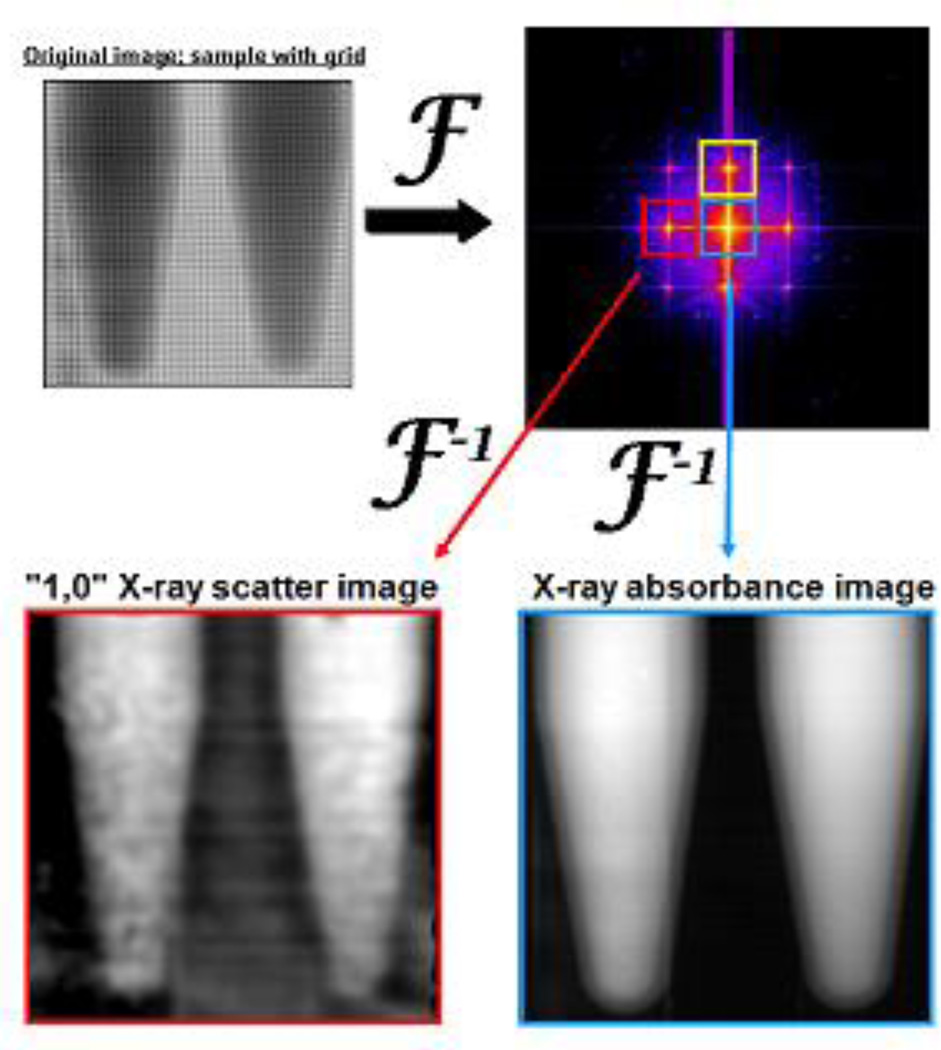
Figure 2.
Fourier transformation of an image with grid and sample placed in the x-ray beam path (top left) gives a convolution in the spatial frequency domain (top right). Different peaks in the spatial frequency spectrum (surrounded by colored boxes) contain different information regarding how the sample scatters and absorbs incident x-radiation.

