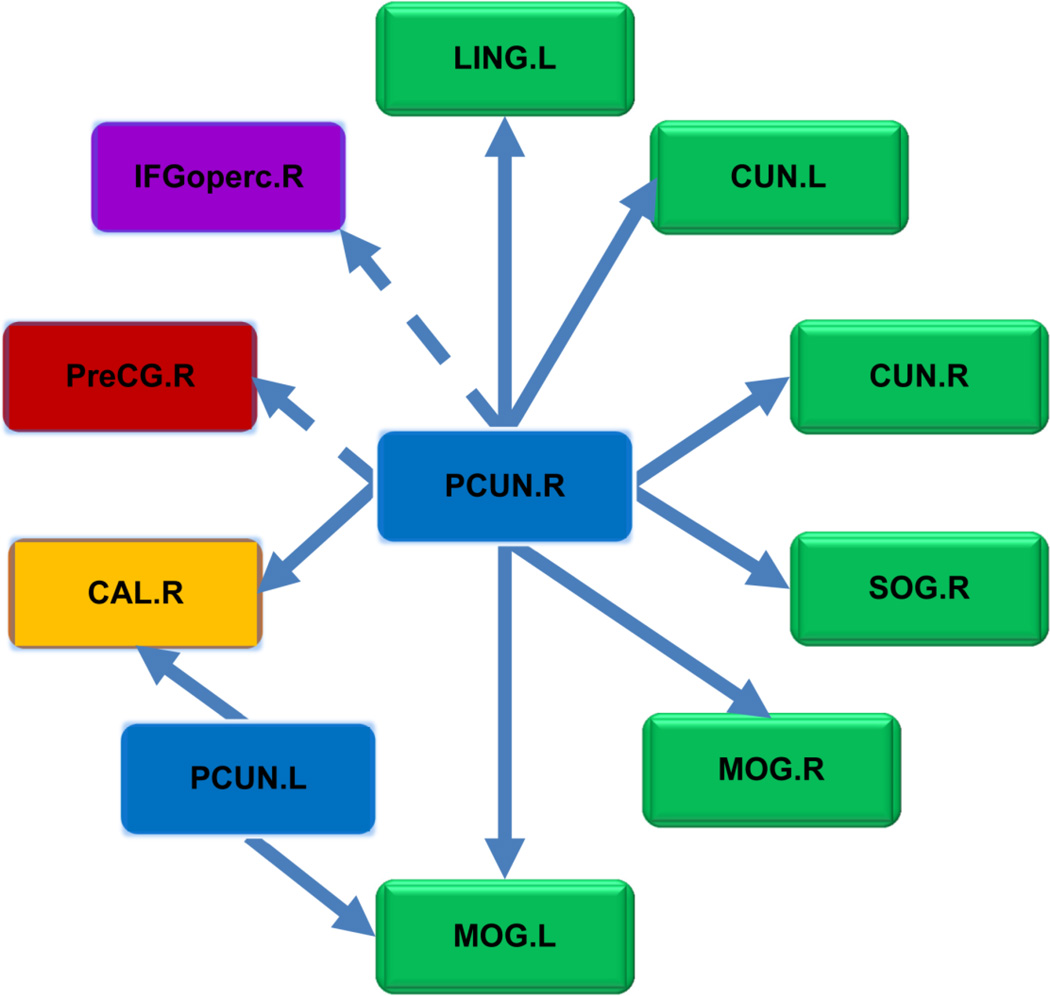
Figure 9.
Information flows from precuneus inferred by the average Granger causality based on the optimal time window dividing algorithm. The brain regions for visual recognition are marked in green, the primary visual cortex is marked in yellow, the sensory motor areas are marked in red, and the attention areas are marked in purple. The arrows marked by dotted lines indicate potentially false predictions owing to the regional variation of the HRF. The brain regions are defined by AAL90, as in DPARSF (Yan and Zang, 2010).

