Figure 2.

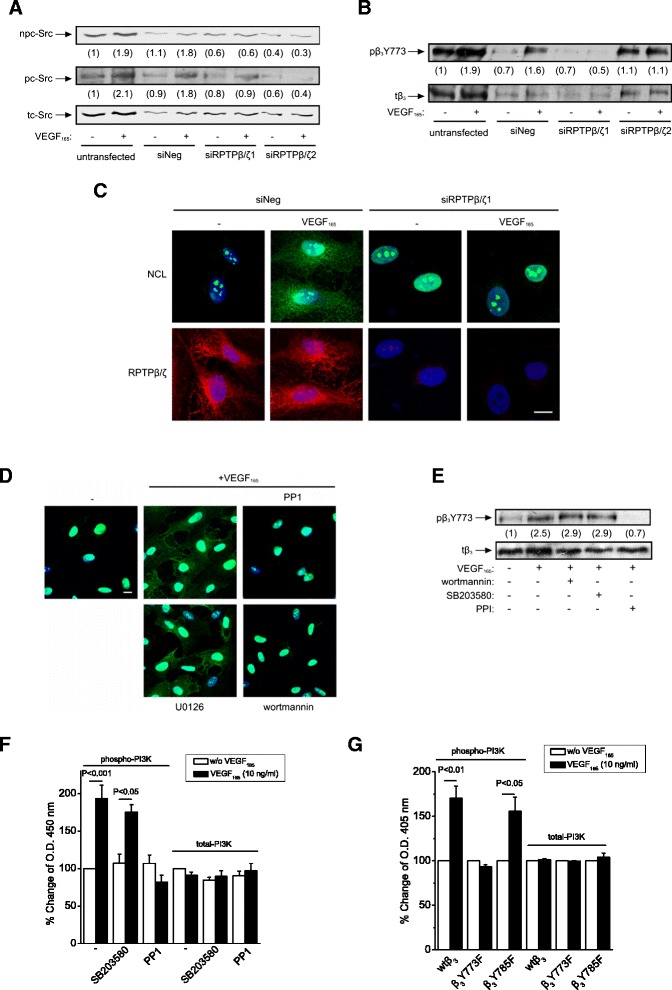
RPTPβ/ζ is required for VEGF 165 -induced cell surface NCL localization. Serum starved HUVEC were treated with VEGF165 (10 ng/ml) for 10 min. Cell lysates were analyzed by Western blot for non Tyr530 phosphorylated (npc-Src), Tyr419 phosphorylated (pc-Src) and total (tc-Src) c-Src (A), as well as for phospho-β3Y773 (pβ3Y773) and total β3 (tβ3) integrin (B). Numbers in brackets denote the average-fold change of the ratio npc-Src:tc-Src, pc-Src:tc-Src or pβ3Y773:tβ3 respectively, compared with the corresponding non stimulated, untransfected cells (set as default 1). (C) Representative immunofluorescence images stained for NCL (green), RPTPβ/ζ (red) and nucleus (blue) from serum starved HUVEC treated with VEGF165 (10 ng/ml) for 5 h at 37°C. (D) Representative immunofluorescence images stained for NCL (green) and nucleus (blue) from serum starved VEGF165-stimulated HUVEC in the presence or absence of inhibitors for c-Src (PP1 10 μΜ), PI3K (wortmannin 100 nM) and ERK½ (U0126 20 nM). Scale bars in C and D correspond to 10 μm. (E) Lysates from serum starved VEGF165-stimulated HUVEC in the presence or absence of PP1 and wortmannin, were analyzed by Western blot for pβ3Y773 and tβ3 integrin. Numbers in brackets denote the average-fold change of the ratio pβ3Y773:tβ3 compared with untreated cells (set as default 1). (F and G) Phosphorylation of PI3K in HUVEC and CHO cells respectively. Data are expressed as mean ± s.e.m percentage change in PI3K compared with the untreated cells (set as default 100). In all cases, data come from three independent experiments. siNeg, HUVEC transfected with a negative control siRNA; siRPTPβ/ζ1, HUVEC transfected with siRPTPβ/ζ#1; siRPTPβ/ζ2, HUVEC transfected with si RPTPβ/ζ#2; vector, CHO cells transfected with the plasmid vector; wtβ3, CHO cells over-expressing wild-type β3; β3Y773F, CHO cells over-expressing β3Y773F; β3Y785F, CHO cells over-expressing β3Y785F.
