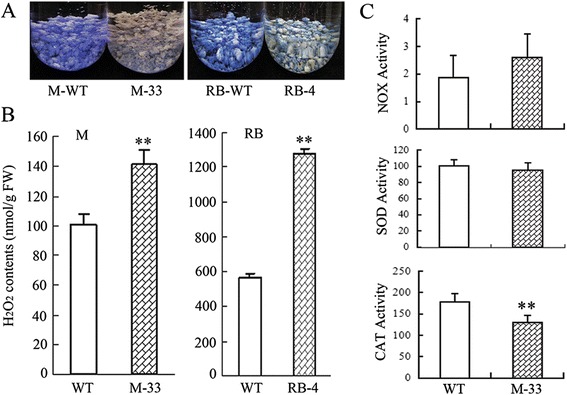
Figure 3.

Determination of ROS levels and the activities of related enzymes in calli. M-33, and RB-4 represent the ECM lines of Marsh grapefruit and Star Ruby grapefruit, respectively. WT represents wild-type calli. (A) O2 - is detected by histochemical staining with NBT. M and RB are shown as representatives for O2 - levels. (B) H2O2 determination is based on the titanium reagent method. (C) NOX activity (nmol NADPH/min/g FW), SOD activity (U/g FW) and CAT activity (U/g FW) were analyzed in the M-33 and its wild-type control. The columns and bars represent the means and ± SD, respectively (n = 3 replicate experiments). **Indicates that the values are significantly different compared with wild type at the significance level of P < 0.01.
