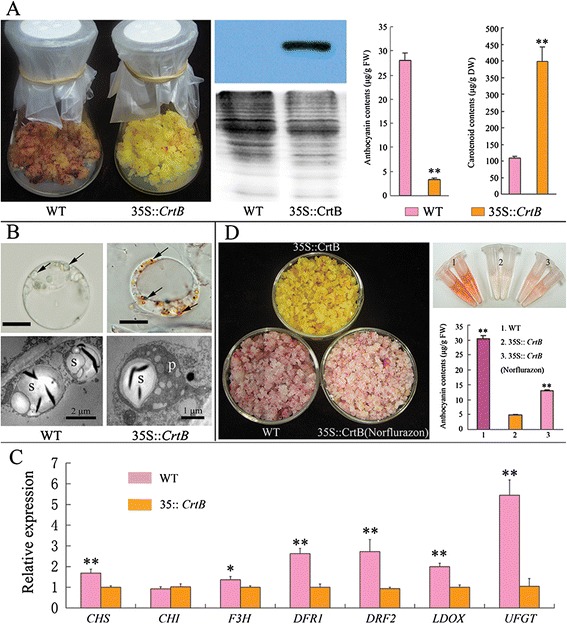
Figure 6.

Pigment accumulation in the transgenic M. hupehensis callus with overexpressive CrtB gene. (A) Left image shows the phenotypes of the M. hupehensis calli cultured under visible light condition; middle image is the western blotting confirmation of CrtB protein, coomassie blue staining for loading control; right image displays the results of pigment (anthocyanins and carotenoids) levels analysis, columns and bars represent the means and ± SD, respectively (n = 3 replicate experiments); 35S:: CrtB represents the apple ECM. (B) Cytological investigation of M. hupehensis callus shows the amyloplasts in the wild-type cell, and the chromoplast-like structures in the ECM cell (arrows shown); s, starch granule; p, plastoglobule; m, mitochondrion. Bars represent 10 μm. (C) qRT-PCR analysis of anthocyanin related genes in the M. hupehensis calli. UFGT, uridine diphosphate (UDP)-glucose: flavonoid 3-O-glycosyltransferase; LDOX, leucoanthocyanidin dioxygenase; DFR1/2, dihydroflavonol 4-reductase 1/2; F3H, flavanone 3 β-hydroxylase; CHI, chalcone isomerase; CHS, chalcone synthase. Columns and bars represent the means and ± SD, respectively (n = 3 replicate experiments). 35S:: CrtB represents the light-cultured apple ECM; WT represents the light-cultured wild-type apple callus. (D) Phenotypes and pigment analyses under norflurazon treatment for 20 days. The medium contained 10 μM norflurazon. Columns and bars represent the means and ± SD, respectively (n = 3 replicate experiments). Transcript levels are expressed relative to the apple ECM (35S:: CrtB). * and ** indicate that the values are significantly different at the significance levels of P < 0.05 and P < 0.01, respectively.
