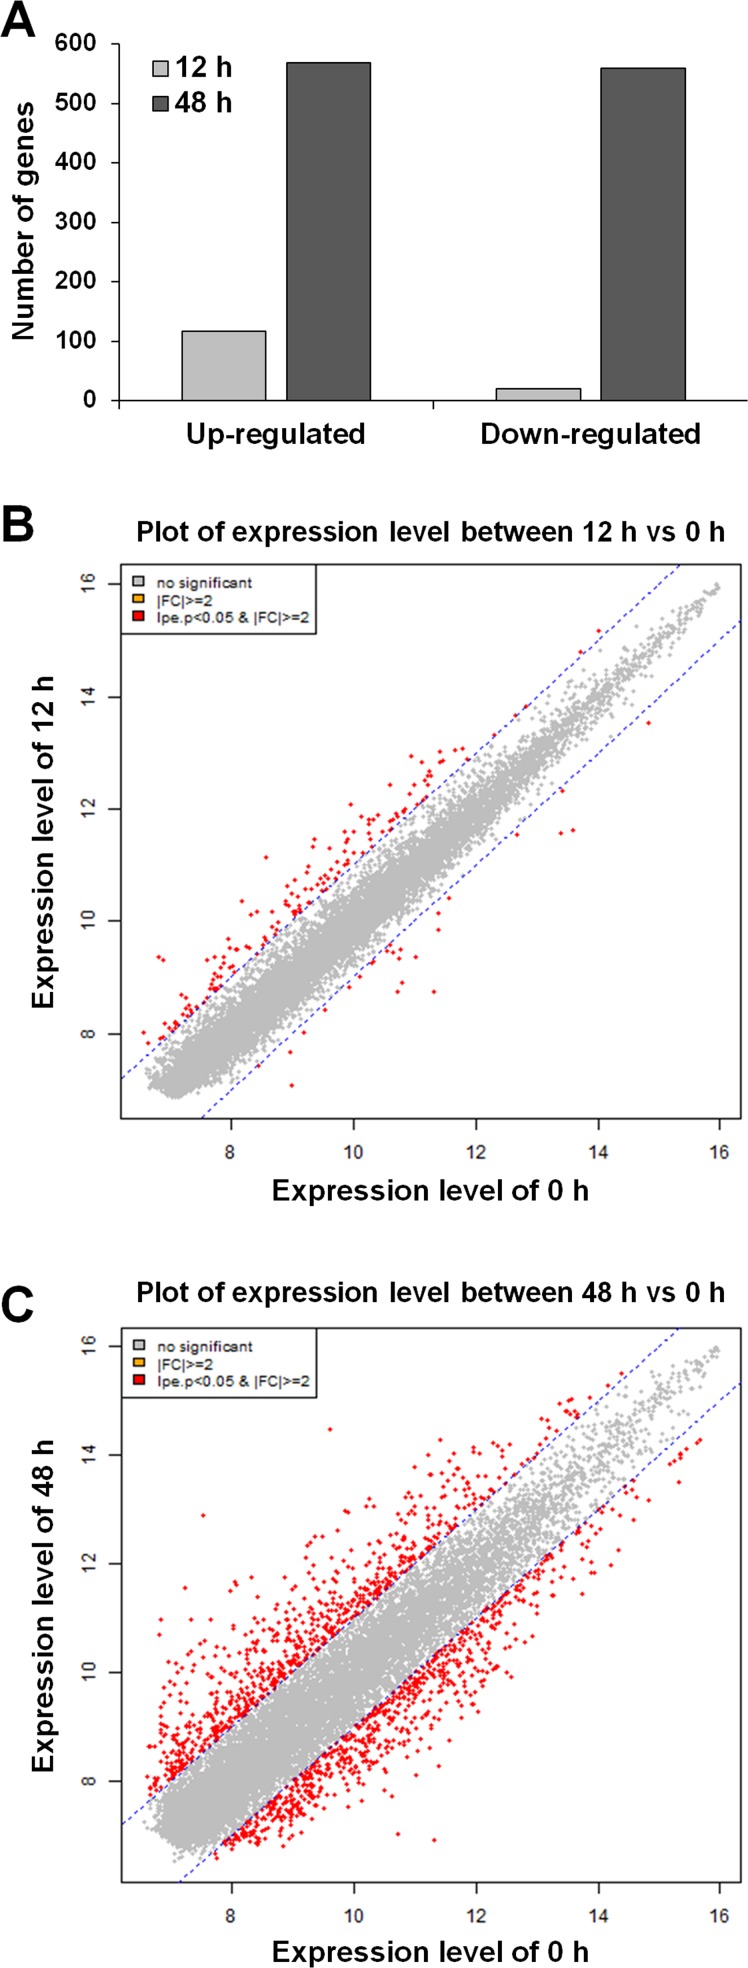
Fig 3. Different gene expression after treatment with 100 μg/mL of MFP.
(A) Count of up-and down-regulated genes in RAW 264.7 cells treated with MFP 100 μg/mL compared to nontreated. (0 h; p < 0.05, |fold change | ≥ 2). (B) and (C) Plots of the expression level between nontreated cells versus those treated with 100 μg/mL MFP for 12 or 48 h. Red dots present an expression level change of ≥ 2 or ≤ -2-fold for both up- and down-regulated genes. Expression levels were calculated by base 2 logarithm of normalized hybridization signals from each sample.

