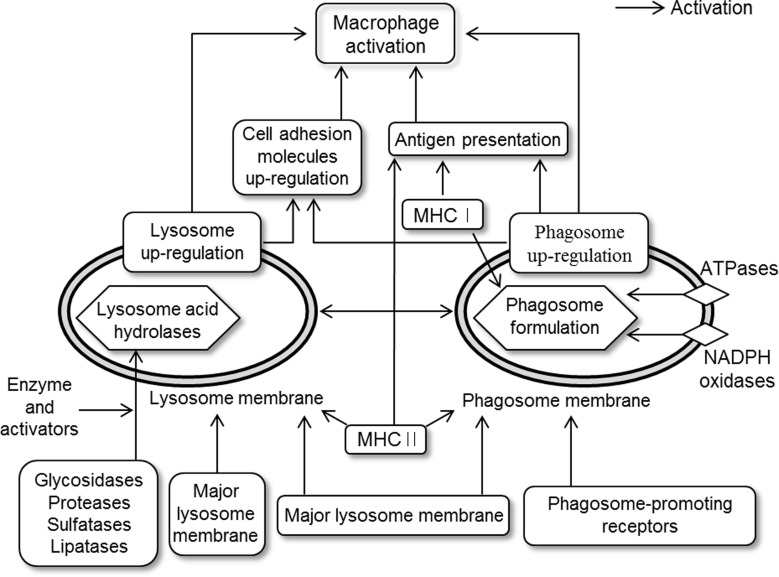
Fig 10. Suggesting diagram of activation pathways.
This diagram was determined through the analysis of genes whose expression level was altered in RAW 264.7 cells that were treated with MFP 100 μg/mL. MFP treatment up-regulated the pathways of lysosome and phagosome. The pathway mapping was conducted using KEGG database.

