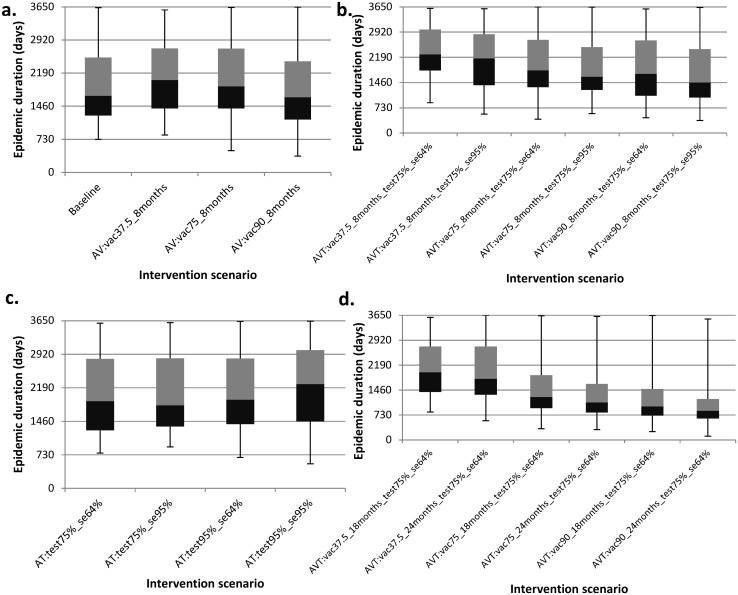
Fig 3. Boxplots for the predicted effects of the various intervention scenarios on the epidemic duration.
Panel (a) presents epidemic durations under the baseline and annual vaccination (AV) strategies. Panel (b) depicts epidemic durations under the annual vaccination and testing (AVT) strategy for different test sensitivity and vaccination coverage. Panel (c) presents epidemic durations under the annual testing (AT) strategy for varying test sensitivity and tested fraction. Panel (d) shows epidemic durations under the annual vaccination and testing (AVT) strategy for varying vaccine protection duration and vaccination coverage. As an example, scenario “AVT:vac37.5%_8months_test75%_se64%” represents an annual vaccination and testing strategy in which the effective vaccination coverage is 37.5% with a vaccine that protects for eight months together with testing of 75% of the animals with a 64% sensitive test.

