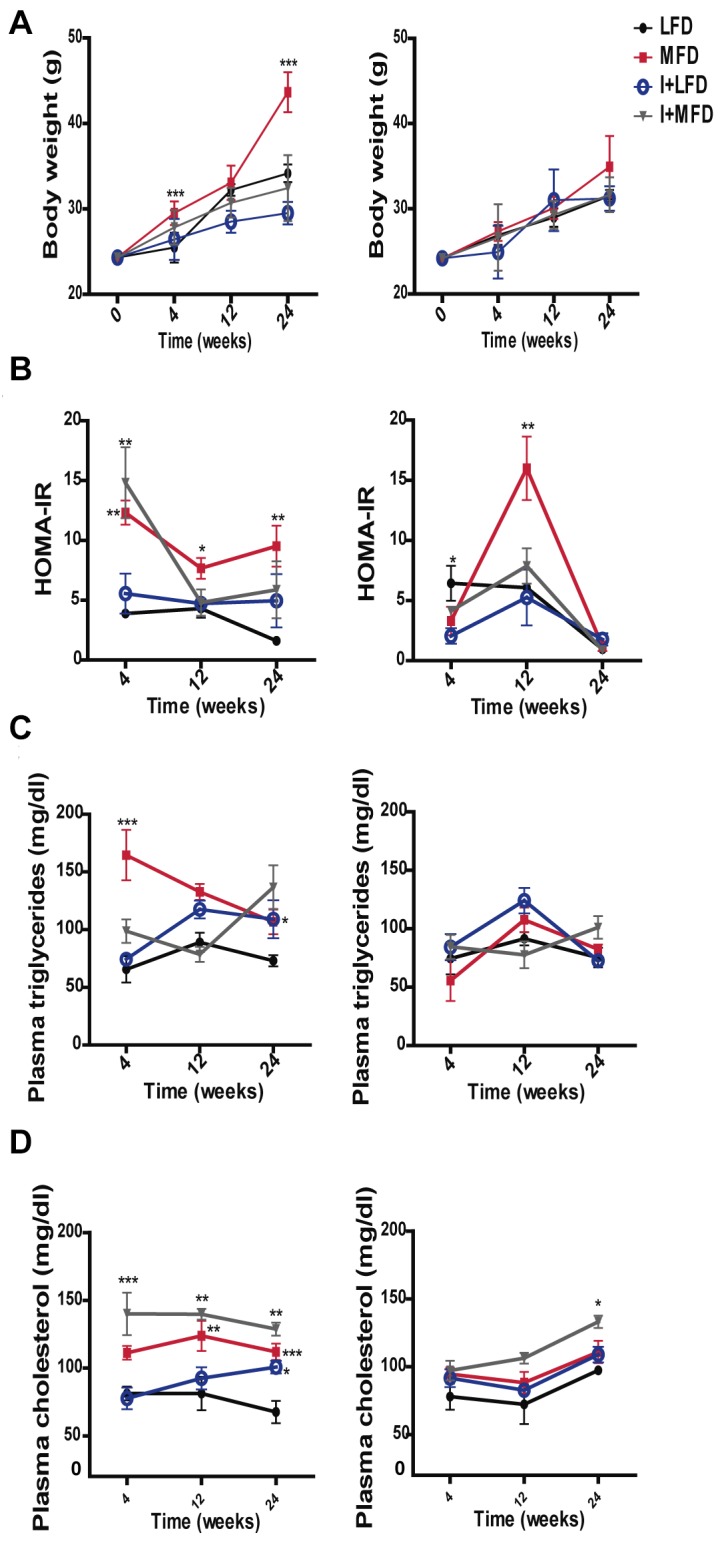
Figure 1. Metabolic abnormalities associated with diet-induced overweight and infection with T. cruzi.

Metabolic parameters were measured after a 10-h fasting in mice on either MFD, LFD, I+MFD or I+LFD groups of WT and TLR4-/- mice at 4, 12 or 24 weeks, including: (A) Body weight ***p < 0.001 MFD vs. LFD at 4 and 24 weeks in WT; LFD vs. I+LFD **p < 0.01 at 12 and 24 weeks WT and ***p < 0.001 MFD vs. I+MFD at 24 weeks in WT. (B) Changes in plasma HOMA-IR in WT mice: **p < 0.01 MFD vs. LFD at 4 weeks, **p < 0.01 I+LFD vs. I+MFD at 4 weeks and MFD vs. LFD at 24 weeks, *p < 0.05 MFD vs. LFD at 12 weeks; Changes in plasma HOMA-IR in TLR4-/- mice: *p < 0.05 LFD vs. I+LFD at 4 weeks, ***p < 0.001 MFD vs. LFD, I+LFD and I+MFD at 12 weeks. (C) Plasma triglycerides concentrations in WT mice: ***p < 0.001 MFD vs. LFD at 4 weeks, **p < 0.01 MFD vs. I+MFD at 4 weeks. (D) Plasma cholesterol concentrations in WT mice: ***p < 0.001 I+LFD vs. I+MFD at 4 weeks; **p < 0.01 MFD vs. LFD and I+LFD vs. I+MFD at 12 weeks; ***p < 0.001 MFD vs. LFD at 24 weeks, *p < 0.05 LFD vs. I+LFD at 24 weeks and **p < 0.01 I+LFD vs. I+MFD at 24 weeks. The analysis in TLR4-/- groups: *p < 0.05 I+LFD vs. I+MFD and MFD vs. I+MFD at 24 weeks. n > 10 for each mice group were analyzed at all times studied. Data are shown as mean ± SEM of a representative assay from three independent experiments. A p-value <0.05 was considered significant using Two-way ANOVA test.
