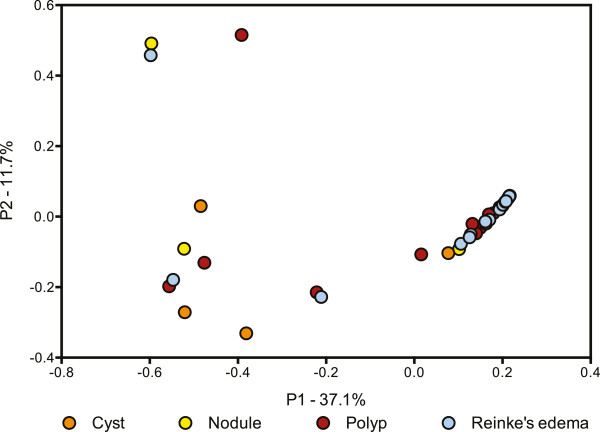
Figure 2.

Comparison of bacterial community structure in benign vocal fold lesions. PCoA based on Theta Yue Clayton distances illustrating the clustering of most lesion samples, regardless of lesion diagnosis. Lesion samples are shown as circles, cysts as orange circles, nodules as yellow circles, polyps as red circles, and Reinke’s edema as blue circles.
