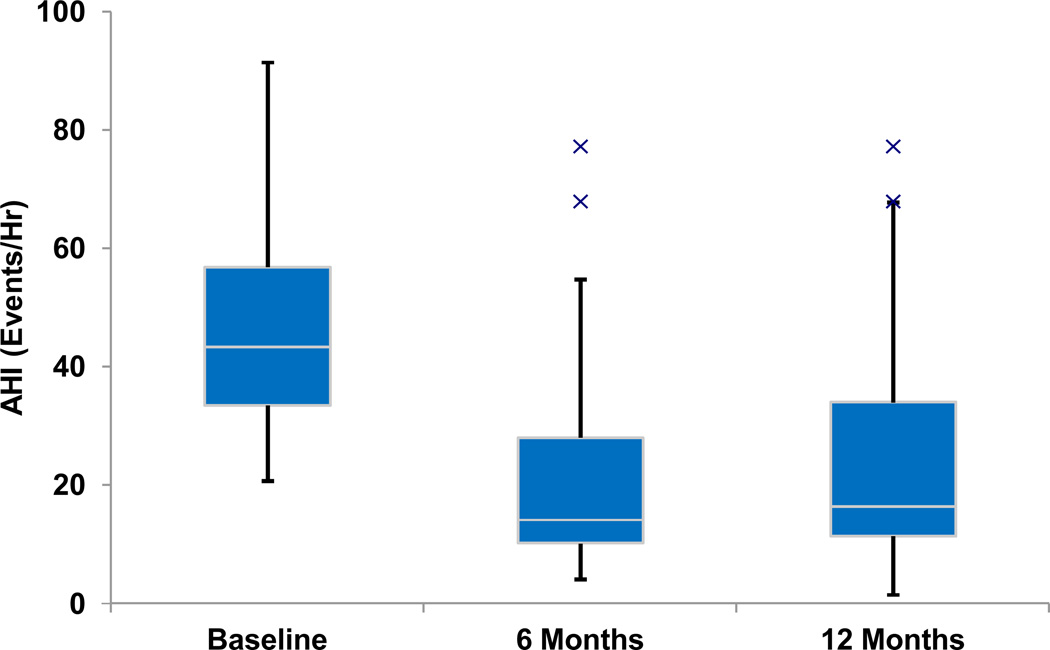
Figure 2.
Box and whisker plot of the apnoea-hypopnoea index at baseline and at 6 and 12 months post implantation. The median values are noted by horizontal white lines, and the boxes represent the intraquartile range. The whiskers represent the 1.5x the intraquartile range (or the minimum or maximum value if < 1.5x the intraquartile range). The Xs represent outlier values.

