Abstract
High-resolution (HR) mapping employs multielectrode arrays to achieve spatially detailed analyses of propagating bioelectrical events. A major current limitation is that spatial analyses must currently be performed “off-line” (after experiments), compromising timely recording feedback and restricting experimental interventions. These problems motivated development of a system and method for “online” HR mapping. HR gastric recordings were acquired and streamed to a novel software client. Algorithms were devised to filter data, identify slow-wave events, eliminate corrupt channels, and cluster activation events. A graphical user interface animated data and plotted electrograms and maps. Results were compared against off-line methods. The online system analyzed 256-channel serosal recordings with no unexpected system terminations with a mean delay 18 s. Activation time marking sensitivity was 0.92; positive predictive value was 0.93. Abnormal slow-wave patterns including conduction blocks, ectopic pacemaking, and colliding wave fronts were reliably identified. Compared to traditional analysis methods, online mapping had comparable results with equivalent coverage of 90% of electrodes, average RMS errors of less than 1 s, and CC of activation maps of 0.99. Accurate slow-wave mapping was achieved in near real-time, enabling monitoring of recording quality and experimental interventions targeted to dysrhythmic onset. This work also advances the translation of HR mapping toward real-time clinical application.
Index Terms: Dysrhythmia, gastric electrical activity, interstitialcells of Cajal, software, visualization
I. Introduction
Gastric motility is regulated by slow-wave activity, generated and propagated by interstitial cells of Cajal, and dysrhythmic slow-wave activity is associated with gastric dysmotility [1], [2]. High-resolution (HR) electrical mapping enables the analysis of slow-wave activation sequences in spatiotemporal detail. Arrays of multiple electrodes are used to simultaneously or sequentially record extracellular potentials at multiple sites, so that propagation patterns can be reconstructed from the activation times detected at each electrode [3], [4]. HR mapping has been extensively applied to define normal and aberrant slow-wave patterns in animal models [5], [6], and recently in humans [7], [8].
A major current barrier to progress in experimental and clinical HR slow-wave mapping is the inability to perform analyses “online,” i.e., during the recordings. At present, only selected electrograms can be viewed during experiments, while all spatial and graphical representations of the data must be performed after recordings have been completed [9]. This restriction is a particularly significant limitation to trialing therapeutic investigations, because manipulations such as gastric pacing for dysrhythmia ideally require immediate feedback of the transient and dynamic responses in slow-wave activity [10]. In addition, suboptimal electrode positioning currently goes undetected during experiments, potentially compromising outcomes.
Online electrophysiological analysis tools that allow near real-time HR mapping are in routine clinical usage in cardiology, enabling clinicians to diagnose and treat cardiac dysrhythmias in their intervention suites [11], [12]. This clinical paradigm is also a feasible vision for gastric dysrhythmia, and the development of an online analysis platform would be a significant translational step. However, existing cardiac approaches cannot simply be adapted for gastric slow-wave analyses, due to the differences in slow-wave propagation and signal characteristics [13], [14]. Recently, a series of studies have presented robust event identification, cycle partitioning, and mapping algorithms specific for enabling automated slow-wave analyses, but the complexity means their computational demand is unsuitable for online usage [9], [13], [14].
This study addresses the above problems by presenting a new system and method for online HR gastric slow-wave mapping. Specifically, this study presents the following advances: 1) a simplified, robust and computationally efficient adaptation of existing slow-wave identification and partitioning algorithms suitable for online use; 2) a statistical method for calculating the likelihood of accurate event detection occurring in a particular channel, allowing the online identification and elimination of channels containing false-positive (FP) data to improve mapping accuracy; and 3) a user-friendly software package for online mapping, which can be readily integrated with existing methods of HR data acquisition. The developed system and method was tested in vivo in a porcine model, and validated against existing off-line and manual analysis approaches. Aspects of this software and preliminary results have previously been reported in abstract form at an IEEE EMBS conference [15].
II. Methods
A flowchart outlining the system of online mapping developed here is illustrated in Fig. 1. Steps in the workflow are detailed in the subsequent sections.
Fig. 1.
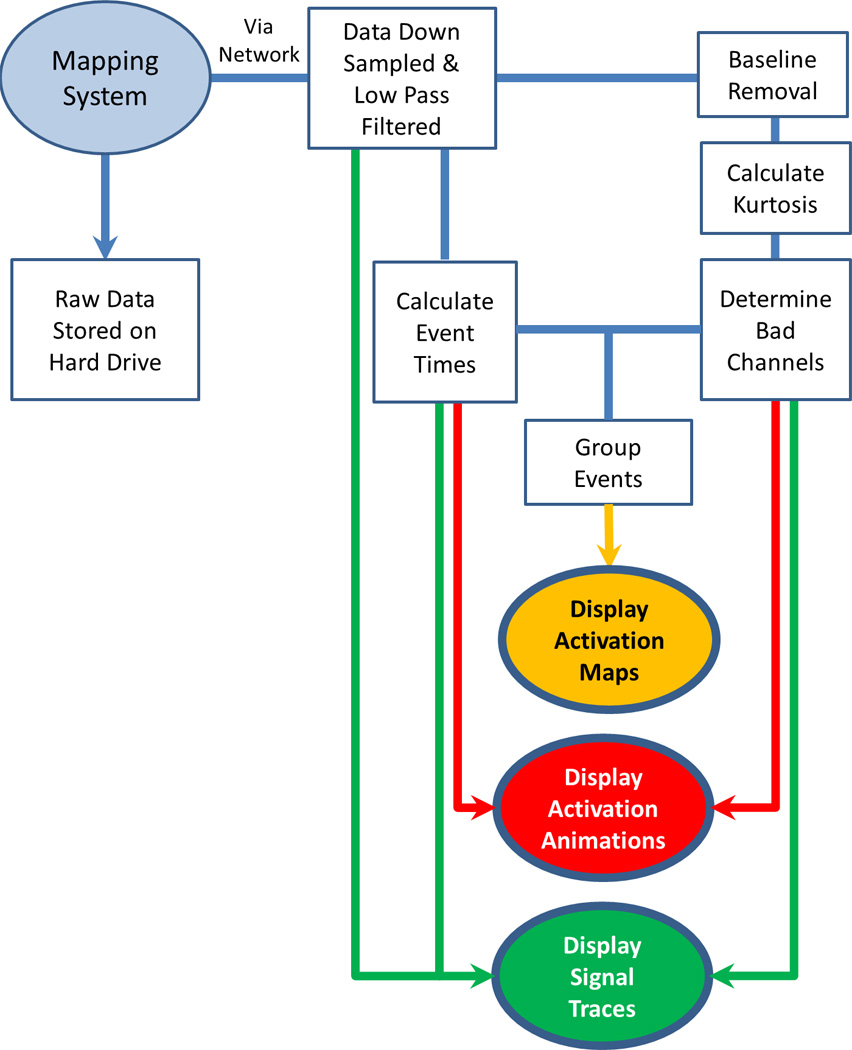
Flowchart illustrating the system developed to process online HR slow wave data. The signal input is shown in a light oval, the processing modules in rectangles, and the outputs in dark ovals.
A. Filtering
Sources of noise in extracellular recordings, such as cardiac activity (1 Hz), baseline drift (< 0.2 Hz), and main interference (50/60 Hz), may be reduced by filtering [16]. An online signal filtering strategy was devised based on a selection of previous off-line filtering practices [16], [17] that were deemed most suitable for online analyses due to their computational efficiency. Input signals were first down sampled to 32 Hz using a Chebyshev type 1 filter to reduce data volumes (see the Appendix) [18]. Low-frequency drift was removed using a long finite impulse response (FIR) filter [18]. An FIR filter was selected due to its speed, and to reduce the size of the computational buffer required to store the processed information compared to off-line methods [9]. A second-order Butterworth filter (high-frequency cutoff 1 Hz) was then applied for high frequency noise [16].
B. Event Detection
Accurate detection of activation times (ATs) is fundamental to extracellular potential mapping [19]. The AT indicates the arrival of a propagating wave front under an electrode, and corresponds to the maximum negative gradient of an extracellular event [20]. Erickson et al. [13], [14] previously presented an algorithm for the off-line detection of slow-wave ATs, termed the “Falling-Edge Variable-Threshold” (FEVT) method, which remains accurate in the presence of moderate noise. In order to apply the FEVT method in online detection, we made the modifications detailed below (see the Appendix for equations).
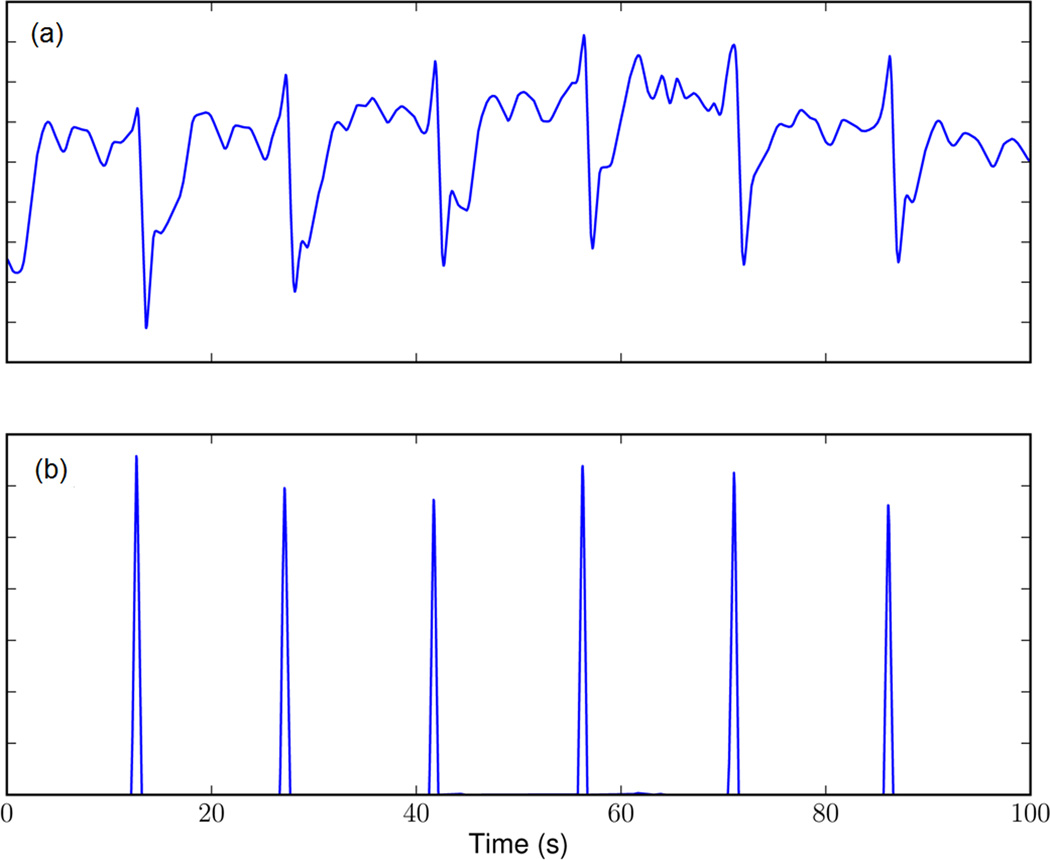
Essential to FEVT is a signal transform termed the “nonlinear energy operator” (NEO) [21], which was also applied to the online signals. The NEO transform generates a strong response to the rapid downward deflection of the extracellular slow-wave event [13]. The NEO signal was smoothed and piece-wise multiplied with a further signal obtained by convolving the same input signal with an “edge detection kernel” (detailed in [13]), giving a “detection signal.” The detection signal provides brief positive spikes corresponding to slow-wave ATs, and a much smaller response to deflections of noise (e.g., see Fig. 2).
Fig. 2.
Detection of slow-wave events. (a) Filtered signal trace and (b) the corresponding “detection signal” gives a short positive response to the downward slope of extracellular gastric slow-wave events (indicating a wave front passing under the electrode), and a much smaller response to the alternative downward deflections of competing noise.
The FEVT method further included a variable threshold for AT identification, based on signal intensity [13]. However, this variable threshold method was unsuitable for online use because it was calculated from the complete recorded signals. Instead, the online threshold was calculated by a median absolution deviation method [22] but using a mean calculation method instead of median for computational efficiency (see the Appendix). “Candidate ATs” were identified when the detection signal exceeded an empirically defined (species-specific) threshold. Only the candidate AT of highest magnitude within a specified time window was then marked for further processing, with the remainder being discarded. This step prevented multiple ATs being detected within a short period which is usually not physiological, except during instances of slow-wave reentry or wave collisions, which may generate “double potentials” [6]).
C. Detection of Signal Fidelity
A novel signal fidelity measure was introduced for online recordings. Due to areas of quiescence in the normal stomach, it is not always immediately obvious experimentally whether a recording channel containing no signal has poor contact, or is over an inactive region [7], [23], [24]. The FEVT algorithm may report FPs in such channels, due to the “variable threshold,” causing a response to a lack of true-positive (TP) events in the presence of noise [13]. These FPs do not presented a major problem during off-line analysis, because they can be manually removed given sufficient time, but it is critical to minimize FPs online to provide accurate data, and particularly because FPs distort automated mapping analyses [14], [22].
A novel approach to assessing signal fidelity online was developed by assessing a moving estimate of signal “kurtosis” [25]. A kurtosis-based approach was chosen based on the observation that signals recording TP events generally show a small range with periodic slow-wave deflections, whereas channels recording FPs tend to show a more consistent variation around a mean value, representing random noise or ventilator signal [13]. Additional information on the kurtosis method is provided in the Appendix.
D. Cycle Clustering
The traditional outputs of mapping are isochronal activation maps to quantify electrical propagation sequences. Activation maps effectively condense a large volume of information into a format that is easily and rapidly read by the user [12]. However, in order to generate activation maps, it is first essential to group together (cluster) all ATs that arise from each propagation cycle. Erickson et al. previously presented a region-growing approach to group ATs from seeding electrodes known as REGROUPS [14]. REGROUPS cannot be applied for online recordings because the method requires input of complete recorded sequences in their entirety.
Instead, a modified “wave-mapping approach” was employed for online use, based on a search and sort routine [26]. Lists of “candidate waves” were maintained that each consisted of a list of ATs. Each newly identified AT was added to a candidate wave if at least one recent AT in that wave closely matched the new AT in time and space. If a candidate wave had no recent ATs, then it was considered complete. Complete waves were further tested against a specified “minimal coverage parameter,” and only accepted waves were recorded for mapping (below) or saving to file.
E. Data Display
1) Animations
Animation sequences were chosen as the primary method for visualizing data online. These animations (refer to supplementary animations) consisted of a grid of cells representing each of the recording electrodes. Each cell would initially be assigned a “baseline” color, then when a slow-wave event passed under each electrode it would be highlighted a particular color (e.g., bright green in Fig. 3). The cell would then gradually returned to the original “baseline” color over time (e.g., black in Fig. 3). The red color represents a cell where a potential slow wave was detected but the system had low confidence of the accuracy of detection.
Fig. 3.
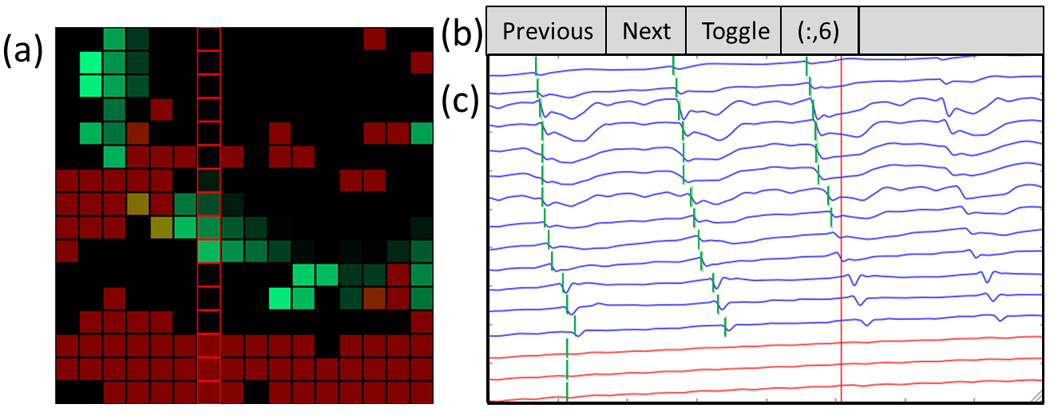
Screenshot of the interface developed to enable online HR mapping. The dataset include multiple low SNR channels, as well as a patch of electrodes over a quiescent region of the stomach (i.e., bottom three rows of the array). (a) Animation window. The wave front is propagating from top-right to bottom left (see also the corresponding animation Figure3_animation.mp4, available in the online supplementary material). Reliable channels (anticipated to contain TP data) are colored green, while unreliable channels (anticipated to contain FP data) are red. (b) User controls. Users can “toggle” to view a column or row of electrodes, and change their selection to the next or previous row or column. (c) Signal traces from the user-selected electrograms with reliable channels (blue), unreliable channels (red), and detected activation times (vertical green bars). The vertical red line indicates the point in time currently being animated. Column of red squares outline electrodes are shown in the signal traces.
The advantages of animations over activation maps in the online context include relative insensitivity to random noise (false-positive/false-negative data) due to human pattern recognition, a continually updating display, and the ability to demonstrate complex dysrhythmias not easily amenable to static activation mapping (e.g., reentry) [27]. Animations have been successfully applied to complex slow-wave dysrhythmias in several previous studies (e.g., [5], [8]). Online animations were generated by our previously described methods using unclustered ATs [9].
2) Isochronal Activation Mapping
Activation mapping was included as a secondary display option. Each activation map typically quantifies propagation over many sec., and several maps can be viewed simultaneously to allow several minutes of data to be reviewed and compared. Online activation mapping was performed using clustered ATs, using the spatial visualization and interpolation (SIV) scheme [14].
3) Graphical User Interface
All of the above system elements were incorporated into a graphical user interface (GUI) with three features (see Fig. 3): 1) live animation of ATs; 2) display of electrograms; and 3) secondary view for activation mapping. The animation represents the electrodes as an array of flashing lights, corresponding to AT detection, with color-coding according to signal fidelity to distinguish “accurate channels” (expected to contain reliable ATs) from “inaccurate channels” (expected to contain unreliable ATs) [see Fig. 3(a)]. The user selects a row or column from the array, for which the electrograms are shown [see Fig. 3(b) and (c)]. Viewing lines of stacked electrograms provides an interpretable quantity of data and allows users to assess for an anticipated propagation “lag” between consecutive channels. When viewing activation maps, the most recently discovered map is displayed, with the option to also display earlier maps. Viewing multiple maps can reduce the time spent watching the animation, and helps in the identification and characterization of dysrhythmic features such as pacemakers (normal and ectopic) and conduction blocks [5], [6], [8].
F. Implementation in a Python Software Package
In our laboratory, recordings are performed using the BioSemi Active Two acquisition system and a modified version of the ActiView recording software (Biosemi, The Netherlands), which is written in LabView (National Instruments, Austin, TX, USA). A novel Python programming-language software package was interfaced with this system, as described below. Importantly, however, the online mapping software presented here could also be modified to function with a range of alternative acquisition systems used in other laboratories.
Raw data was streamed from ActiView via a “TCP server” feature that allows client software to connect via a “socket,” either on the same computer or over a network, without affecting the recordings. The novel Python software (shown operational in Fig. 3 and Figure3_animation.mp4, available in the online supplementary material) receives, decodes, analyzes, and displays the online data according to system outlined in Fig. 1. For this analysis to occur, the user must also input an additional configuration file that specifies the physical distribution of the recording array.
G. Validation Methods
1) Experimental Data
Ethical approval was granted by the University of Auckland Animal Ethics Committee. Experiments were performed in vivo, in female cross-breed weaner pigs (n = 6, 34–37 kg). In contrast to humans, dysrhythmias occur spontaneously during approximately 15% of intraoperative recordings (50% of cases) in these weaner animals [6], [8].
Methods of animal preparation, anesthesia and monitoring, and surgical access were the same as previously described in another recent study [23]. HR mapping was performed over the gastric serosa, using flexible printed circuit board (PCB) arrays [4]. Each array used in this study had 256 contact electrodes (0.3 mm diameter, 4 mm interelectrode spacing, area of 36 cm2).
2) Validation
Online results were compared to traditional off-line analyses performed in the GEMS software [9]. Six experimental comparison datasets were selected as representative of a typical range of porcine slow-wave propagation scenarios, comprising two each of: normal longitudinal propagation, pacemaker area, conduction block, and circular propagations [6], [23]. These patterns are also representative of a range of known human gastric propagation patterns in health and disease [7], [8].
Two experienced analysts independently analyzed each experiment to create a reference dataset. Each analyst was blinded to the online results, and analyzed the data using validated automated off-line methods [9], [13], [14], followed by comprehensive manual review and correction of every individual AT and clustering outcome. Online automated AT marking outcomes were then compared to this reference dataset according to “sensitivity” (proportion of reference ATs correctly identified online), and “positive predictive value” (PPV; proportion of all ATs identified online that correctly matched reference ATs). The PPV was further calculated using two methods, firstly with all channels being considered (“unmasked”), and secondly only considering channels that the reference dataset (manual marker) had retained as containing reliable marks (“masked”). The unmasked comparison reflects real-life performance of the combined event detection and signal fidelity methods with the PCB electrodes. The masked comparison reflects theoretical outcomes of the methods if given data without any low signal-to-noise (SNR) channels. Full details of these metrics are provided in the Appendix.
The activation maps produced by the online system were also quantitatively compared using the following metrics (see the Appendix): root-mean-squared error (RMSE), mean difference (MD), and Pearson correlation coefficient (PCC). The RMSE and MD provide average absolute and relative differences in times between two methods, while the PCC metric provides a measure of any changes in pattern and is independent of any changes in absolute magnitude. An RMSE and MD error of 0.0 s indicates exact match while a PCC value of 1.0 indicates exact correlation.
In addition to these quantitative analyses, raw data animations were qualitatively compared by two experienced analysts, one reading the animated online data, and the other reading the animated reference dataset. The two analysts independently described the pattern of slow-wave activation and classified any dysrhythmias, before comparing outcomes.
III. Results
A. Stability and Time Delay
The online system analyzed 256-channel experimental data with total stability (no unexpected system terminations) when running on either a laptop or over a network connection. The software functioned with a mean delay to animation of approximately 18 s from capture of experimental data.
B. Event Detection and Activation Mapping Metrics
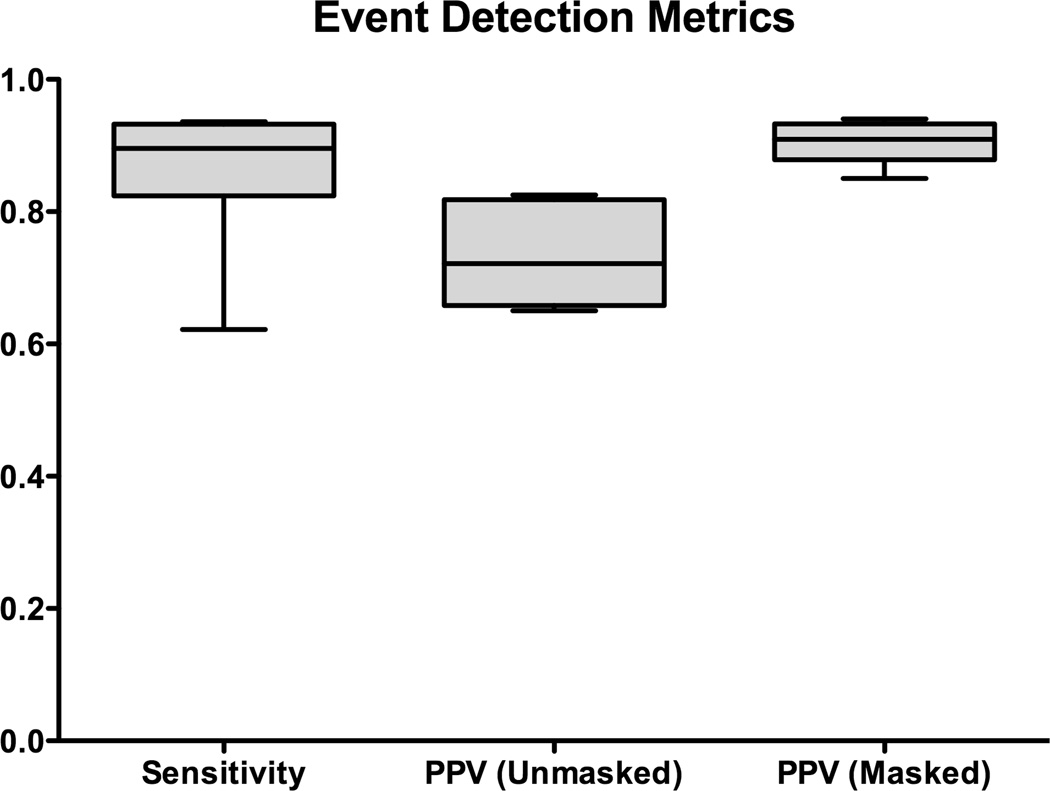
Fig. 4 reports the sensitivity and PPV (masked and unmasked) event detection results across all six datasets and animals. The median AT detection sensitivity was 0.90 (range: 0.62–0.94), indicating that a high proportion of reference ATs were being detected by online analysis. The median “masked” PPV was 0.91 (range 0.85–0.94), and the median “unmasked” PPV 0.72 (range 0.65–0.83), indicating that a high proportion of ATs marked online were true ATs.
Fig. 4.
Automated online marking outcomes (sensitivity and PPV) compared with the reference dataset. The PPV was calculated for masked data (i.e., not including channels with a low SNR that were discarded by the manual marker), and unmasked data (representing real-world accuracy with the applied flexible PCB electrodes).
Slow-wave activation patterns from 59 randomly selected slow-wave cycles across four animals were used for the quantitative comparisons of online versus off-line activation maps. Examples are demonstrated in Fig. 5 (normal pacemaker activity), Fig. 6 (conduction block), Fig. 7 (ectopic pacemaking with looping propagations), and their accompanying animations. For these analyzed cycles, the online method identified an average of 134±6 slow-wave events per cycle, while the off-line method identified 139±5 per cycle (p = 0.27). Of these events, median 122±6 events were identified in common by both methods. The RMSE error between the online and off-line methods was 0.700±0.01 s, with an MD of −0.650±0.004 s. The negative MD value indicates that the ATs determined by the online method were consistently delayed by 0.7 s when compared to the off-line methods, which was due to the use of more simplistic filtering methods by the online method. The activation maps presented in Figs. 5–7 were adjusted to compensate for this delay. The PCC was 0.993±0.002, indicating a high overall concordance between online and off-line activation map patterns.
Fig. 5.
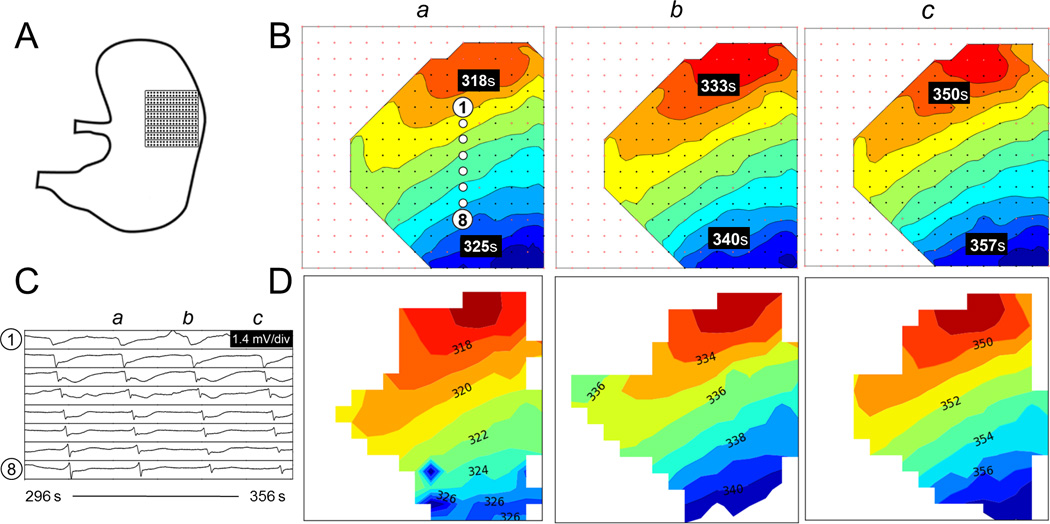
Comparison of activation maps produced for normal pacemaker activity. (A) Position of the electrode array. (B) Off-line activation maps from three consecutive waves (a–c). The isochronal intervals are 1 s. (C) Signal traces (electrograms) from 8 representative electrodes with locations as indicated in B(a). (D) Corresponding online activation maps. Animation of the corresponding time sequence comparing the online and off-line analysis is presented in Figure5_animation.mp4, available in the online supplementary material.
Fig. 6.
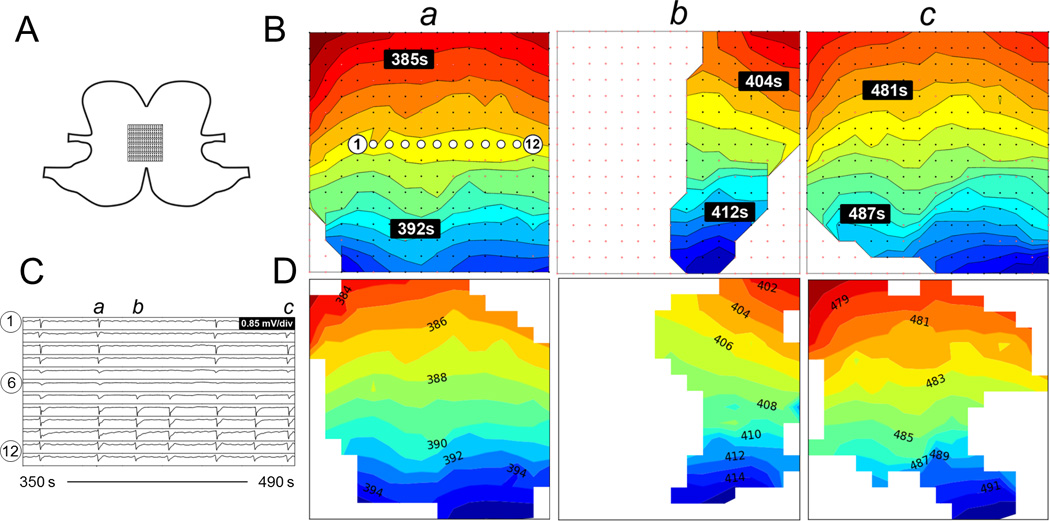
Comparison of activation maps produced from unstable activity with conduction block. A. Position of the electrode array spanning the anterior and posterior surfaces across the greater curvature. B. Offline activation maps from three consecutive waves (a-c). The isochronal intervals are 1 s. C. Signal traces from 12 electrodes with locations as indicated in B(a). D. Corresponding online activation maps. Animation of the corresponding time sequence comparing the online and offline analysis is presented in Figure6_animation.mp4.
Fig. 7.
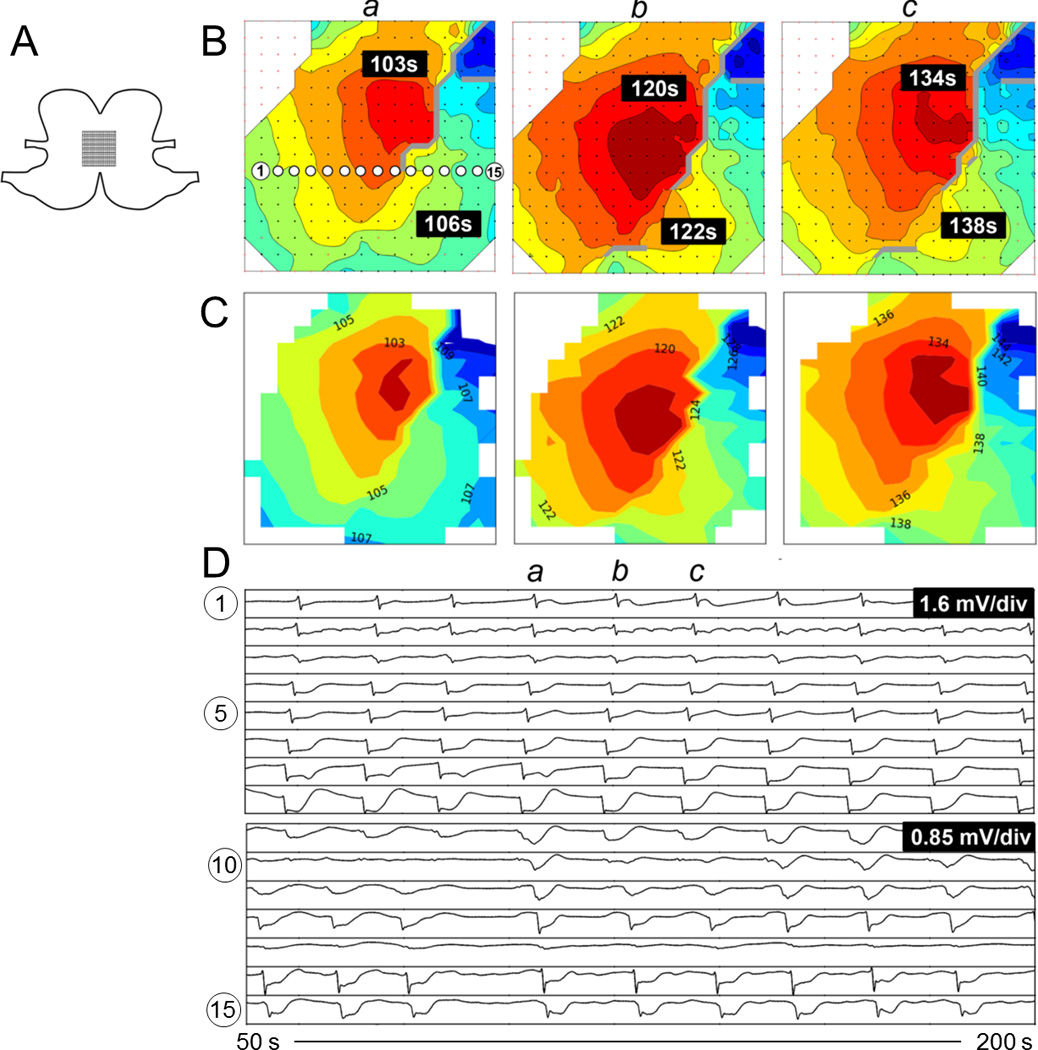
Comparison of activation maps produced from ectopic pacemaking with looping propagations. A. Position of the electrode array spanning the anterior and posterior surfaces across the greater curvature. B. Offline activation maps from three consecutive waves (a-c). The isochronal intervals are 1 s. C. Corresponding online activation maps. D. Signal traces from 15 electrodes with locations as indicated in B(a). Animation of the corresponding time sequence comparing the online and offline analysis is presented in Figure7_animation.mp4.
C. Qualitative Comparison: Activation
Mapping and Animations
The online and off-line methods qualitatively provided similar results with regard to the propagation pattern and direction of propagation (see Figs. 5–7), with 100% classification concordance between the blinded online and off-line analysts. As demonstrated by the animations (see Figure5_animation.mp4, available in the online supplementary material, Figure6_animation.mp4, available in the online supplementary material, and Figure7_animation.mp4, available in the online supplementary material), the reduced PPV of the online versus off-line event detection metrics did not adversely affect the ability to interpret the animations, primarily because of the human visual filtering of background random noise versus patterns, as has been recognized in the cardiac field [27].
The activation maps calculated by the online system tended to have slightly reduced coverage when compared with those found off-line with the help of the REGROUPS algorithm, partly because the cycle clustering tended to terminate early (see Figs. 5–7). This was anticipated, and because the REGROUPS algorithm specifically incorporated a polynomial surface fitting function designed to overcome this problem, which cannot be implemented online [14], [28]. Nevertheless, in the majority of cases, the online maps still provided a reliable view of the slow-wave propagation pattern, because the areas of lost coverage tended to be situated at patches at the edges of the array (where SNR is often lower due to a reduced quality of contact) (see Figs. 5–7), and because FP events are often discarded in a reliable grouping process [14].
IV. Discussion
This study has presented a system, method and software for “online” HR mapping of gastric slow-wave propagation. The platform comprises a series of analytical algorithms coupled to an intuitive GUI, which seamlessly integrates with data acquisition systems. The platform is simple to use and was stable, including when operating over a network connection. Performance was validated in a series of porcine experimental studies encompassing normal and dysrhythmic slow-wave patterns, and quantitative and qualitative results were demonstrated to be sufficient for accurate mapping. The system was designed for optimal computational efficiency, and the lag to animation display (approx. 18 s) is less than the period of one normal human gastric slow-wave cycle [7]. This delay is a fixed time interval over which the system can scan for potential slow-wave events. As the delay is fixed and relatively short compared to the period of gastric slow waves, it should not be a significant issue when used in practice unless the system is adapted to interact directly with the measured events (e.g., electrical stimulation triggered by a particular measured event).
The advances presented here overcome a key barrier to current progress in experimental and clinical HR gastric mapping. Displaying spatial and graphical representations of electrical propagation patterns during live recordings will allow experimental interventions to be targeted to observations of slow-wave patterns in real time. A similar paradigm of real-time mapping and targeted intervention was instrumental in advancing the localization and treatment of cardiac rhythm abnormalities in previous decades [29], [30], and cardiac mapping has since developed into a mature clinical discipline [12]. The clinical significance of gastric dysrhythmias is much less certain than cardiac dysrhythmias; however, evidence continues to accumulate that gastric dysrhythmias are associated with major gastric functional disorders including gastroparesis and functional dyspepsia [8], [31]. Furthermore, gastric initiation and conduction disturbances may be promoted and maintained by complex behaviors resembling those seen in cardiac dysrhythmias, including ectopic pacemaking, reentry, and self-perpetuating conduction block patterns [5], [6], [8]. Given this context, we anticipate that the current work will be a useful translational step toward better elucidating the pathophysiologic and therapeutic significance of gastric dysrhythmias.
Enabling real-time experimental feedback will also substantially improve the reliability of HR mapping experiments. Previously, information about slow-wave propagation patterns during experiments had to be estimated by visualizing selected groups of electrograms (typically a column or row of an electrode array). This provided a limited (one-dimensional) view of the underlying activity. The onset of dysrhythmias may sometimes be appreciable from just a few electrograms, because extracellular slow-wave amplitudes increase up to 2.5× during the circumferential propagation that routinely accompanies dysrhythmia activation patterns [8], [32]. However, only spatiotemporal analyses can reliably identify and classify abnormal gastric slow-wave initiation and conduction patterns, due to their spatial complexity [5], [6]. Dysrhythmia identification can now be performed during experiments, allowing investigators to determine if and when experimental endpoints are met. In addition, sub-optimal position of a mapping array can now be detected and corrected immediately, to avert problems with inadequate tissue contact or partial capture of events of interest. This is particularly important for human intraoperative studies, when data must typically be captured within a tight experimental window [7], [8].
The system was also shown to have robust performance over a computer network. This feature means the resultant software package is sufficiently flexible to be used in a research laboratory, endoscopy suite or operating room, and with the mapping personnel being on-site or off-site.
There has been only one previous attempt at developing a system for online spatial analyses of gastrointestinal electrical conduction [22]. The system presented here includes several improvements over their approach, including an event detection method that is relatively insensitive to noise, computationally efficient automated clustering and mapping, and elimination of noisy channels by kurtosis estimation. Chronic awake studies are needed because all HR studies of gastric dysrhythmia to date been restricted to the anaesthetized and fasted state. Recently, a wireless and potentially endoscopically implantable device was developed as a step toward human telemetric dysrhythmia monitoring [33], and it could be usefully coupled to the system presented here, to help progress this challenge in future work.
The successful development of a kurtosis-based estimate of signal fidelity was a key advance in this work, and this step could now also be applied to improve the efficiency of automated processing of off-line recordings [9]. Currently, significant manual effort is still required to remove false-positives from off-line recordings, particularly in human cases due to operating room noise. Another useful step would be to also include a method for eliminating pacing artifacts from gastric electrograms so that these artifacts do not interfere with automated marking and mapping algorithms during the HR analysis of pacing protocols for dysrhythmia [10].
A limitation of this work is that the AT marking and clustering results were inferior to off-line analyses, which was expected because whole recordings can be processed using superior but much less computationally efficient techniques off-line [13], [14]. Nevertheless, the outcomes were satisfactory, as demonstrated by the quantitative results, and concordance in qualitative analyses of the isochronal maps and animations during experiments. As in cardiac electrophysiology, however, several complexities may impair performance of this system during dysrhythmia mapping [19]. Grouping cycles becomes complex in rhythms such as reentry and fibrillation-type behaviors [5], [8], limiting the utility of online isochronal mapping, though animation remains of great utility. The accuracy of activation time marking can also reduce or become more subjective during dysrhythmia [19], as irregular morphologies may arise due to colliding wave fronts, fractionation of electrograms, double potentials, and amplitude variability [6], [32]. Although the current setup was able to successfully process in near real-time 256 channels with a high sampling frequency, the introduction of additional channels would result in additional delays. Additional channels could readily be monitored by reducing the sampling frequency.
Although the current system has been tuned for gastric slow wave recording, it is possible to adapt the filtering and signal detection parameters to enable analysis of recordings from other parts of the gastrointestinal tract, most notably the slow-wave recordings from the small intestine. As the primary function small intestine involves mixing of the digesta, its slow-wave activity is also more complex and dynamic making construction of isochronal activation maps more complex [34]. However, the animation-based analysis (as shown in Fig. 3 and in the supplementary animations) should provide an immediate assessment of the slow-wave propagation patterns.
In conclusion, this study has presented a new platform for the online analysis of HR gastric slow-wave recordings. This system and method resolves a key problem currently facing HR mapping work, and is anticipated to be a valuable translational step. We are now in the process of applying this technology to intraoperative human studies.
Supplementary Material
Acknowledgment
The authors would like to thank the invaluable contribution of the late Prof. A. Pullan. They would also like to thank L. Nisbett, N. Paskaranandavadivel, and J. Erickson for expert advice and assistance.
This work was supported in part by the NIH (R01 DK64775), the Health Research Council of New Zealand, a Marsden Fast-Start grant and by a New Zealand Postdoctoral Fellowship.
Appendix
Chebyshev Filtering
Signal downsampling was performed using a Chebyshev type I filter
| (1) |
with parameters identical to those previously used in offline analyses: order (Tn=8), passband edge (ω 0 = 0.8 Fs/8), where Fs is the sampling frequency and ripple parameter (ε = 0.05) [9].
Event Detection Algorithm
Online event detection was adapted from the FEVT method [13]. A nonlinear filter termed the NEO was applied to the downsampled and filtered signal [Vi: i∈N]
| (2) |
The resultant signal was smoothed with a moving average filter of width 1 s, resulting in the SENO signal (St). The signals were also convolved with an edge detect kernel (Et). The detection signal was calculated as the element-wise product of the edge detected the kernel and the SNEO signal
| (3) |
An online, variable threshold step was used to derive “candidate ATs” from the detection signal, by an adaptation of the median absolute deviation (MAD) approach [22]
| (4) |
The threshold is determined by the MAD of the detection signal, within a time window, multiplied by a tunable scalar parameter. A window width of 30 s (15 s in each direction), and scalar multiplier of 5.9 was found to be most effective. However, the MAD was found to be computationally inefficient, taking substantial processing time and limiting online analysis of large data sets. Therefore, a mean absolute deviation was used instead, based on the observation that in the majority of channels, the detection signal was typically close to zero at most time points (e.g., see Fig. 2). If more than half of the signal values within the time window were close to zero, then the MAD was close to the mean value. A moving mean was therefore a justified simplification, and functioned with a significant reduction in computational cost.
Similar to the FEVT method, the online method defines a set of “candidate ATs” based on the detection signal F and threshold T
| (5) |
Elements of u having the detection signal F(t) of greatest magnitude within a time window of half-width Tlim were designated ATs, and the remainder of the candidate ATs were discarded. This step prevents multiple ATs being detected within a closely spaced interval. Tlim is a tunable parameter that should be specified according to a priori knowledge about the underlying slow-wave activity and species under evaluation.
Signal Fidelity Assessment by Kurtosis
The kurtosis [25] k(V) of a window from the filtered signal V was defined as
| (6) |
On empirical testing, a kurtosis threshold of 0 and time parameter of 4 s were identified as most effective for classifying “unreliable channels,” i.e., containing an excess of FP ATs.
Validation Metrics for Event Detection
Validation metrics were employed to analyze online event detection accuracy against a reference dataset prepared by an expert analyst. The kurtosis measure of signal fidelity was first applied to remove unreliable channels.
A TP was an online AT that matched a reference AT to within 0.2 s, while an FP was an online AT for which there was no corresponding reference AT within 0.2 s. Erickson et al. [13] had previously applied a threshold time of 1 s. In this study, a substantially more restrictive 0.2 s window was employed for determining either a TP or false positive data point. As noted above, different filtering methods were employed online, compared to standard off-line methods [9], [16]. Although the on-line methods employed more computationally efficient filtering methods, this resulted in a small constant phase-shift in the signals. To account for this, all online signals were adjusted by a negative time shift of 0.65 s for validation purposes.
“Sensitivity” referred to the fraction of online ATs that were also detected by the off-line methods (reference dataset calculated by the expert analyst) while the Positive Predictive Value (PPV) referred to the fraction of erroneous ATs calculated using the online methods
| (7) |
| (8) |
Validation Metrics for Activation Mapping
The activation maps produced by the online method were quantitatively compared with those produced off-line with manual intervention [9]. Results were compared using the RMSE, MD, and PCC metrics
| (9) |
| (10) |
| (11) |
where An and Bn are the activation times being compared at location n, and there are a total of N common activation times, and Ā and B̄ are the mean activation times for each activation map. The RMSE and MD provide an absolute and relative time difference between the two activation maps.
Contributor Information
Simon H. Bull, Email: simonhbull@gmail.com, Auckland Bioengineering Institute, University of Auckland, Auckland 1010, New Zealand.
Gregory O’Grady, Email: ogrady.greg@gmail.com, Auckland Bioengineering Institute, University of Auckland, Auckland 1010, New Zealand.
Peng Du, Email: peng.du@auckland.ac.nz, Auckland Bioengineering Institute, University of Auckland, Auckland 1010, New Zealand.
Leo K. Cheng, Email: l.cheng@auckland.ac.nz, Auckland Bioengineering Institute, University of Auckland, Auckland 1010, New Zealand, and also with Department of Surgery, Vanderbilt University, Nashville, TN 37235 USA.
References
- 1.Chen JD, Pan J, McCallum RW. Clinical significance of gastric myoelectrical dysrhythmias. Dig Dis. 1995;13(5):275–290. doi: 10.1159/000171508. [DOI] [PubMed] [Google Scholar]
- 2.Farrugia G. Interstitial cells of Cajal in health and disease. Neurogastroenterol. Motil. 2008 May;20(Suppl. 1):54–63. doi: 10.1111/j.1365-2982.2008.01109.x. [DOI] [PubMed] [Google Scholar]
- 3.Lammers WJEP, Al-Kais A, Singh S, Arafat K, El-Sharkawy TY. Multielectrode mapping of slow-wave activity in the isolated rabbit duodenum. J. Appl. Physiol. 1993 Mar;74(3):1454–1461. doi: 10.1152/jappl.1993.74.3.1454. [DOI] [PubMed] [Google Scholar]
- 4.Du P, O’Grady G, Egbuji JU, Lammers WJEP, Budgett D, Nielsen P, Windsor JA, Pullan AJ, Cheng LK. Highresolution mapping of in vivo gastrointestinal slow wave activity using flexible printed circuit board electrodes: Methodology and validation. Ann. Biomed. Eng. 2009 Apr;37(4):839–846. doi: 10.1007/s10439-009-9654-9. [DOI] [PMC free article] [PubMed] [Google Scholar]
- 5.Lammers WJEP, Ver Donck L, Stephen B, Smets D, Schuurkes JAJ. Focal activities and re-entrant propagations as mechanisms of gastric tachyarrhythmias. Gastroenterology. 2008 Nov;135(5):1601–1611. doi: 10.1053/j.gastro.2008.07.020. [DOI] [PubMed] [Google Scholar]
- 6.O’Grady G, Egbuji JU, Du P, Lammers WJEP, Cheng LK, Windsor JA, Pullan AJ. High-resolution spatial analysis of slow wave initiation and conduction in porcine gastric dysrhythmia. Neurogastroenterol. Motil. 2011 Sep;23(9):e345–e355. doi: 10.1111/j.1365-2982.2011.01739.x. [DOI] [PMC free article] [PubMed] [Google Scholar]
- 7.O’Grady G, Du P, Cheng LK, Egbuji JU, Lammers WJ, Windsor JA, Pullan AJ. Origin and propagation of human gastric slow-wave activity defined by high-resolution mapping. Am J Physiol Gastrointest Liver Physiol. 2010 Sep;299(3):G585–G592. doi: 10.1152/ajpgi.00125.2010. [DOI] [PMC free article] [PubMed] [Google Scholar]
- 8.O’Grady G, Angeli TR, Du P, Lahr C, Lammers WJ, Windsor JA, Abell TL, Farrugia G, Pullan AJ, Cheng LK. Abnormal initiation and conduction of slow-wave activity in gastroparesis, defined by high-resolution electrical mapping. Gastroenterology. 2012 Sep;143(3):589–598. e1–e3. doi: 10.1053/j.gastro.2012.05.036. [DOI] [PMC free article] [PubMed] [Google Scholar]
- 9.Yassi R, O’Grady G, Paskaranandavadivel N, Du P, Angeli TR, Pullan AJ, Cheng LK, Erickson JC. The gastrointestinal electrical mapping suite (GEMS): Software for analyzing and visualizing high resolution (multi-electrode) recordings in spatiotemporal detail. BMC Gastroenterol. 2012 Jan;12:60. doi: 10.1186/1471-230X-12-60. [DOI] [PMC free article] [PubMed] [Google Scholar]
- 10.O’Grady G, Du P, Lammers WJ, Egbuji JU, Mithraratne P, Chen JD, Cheng LK, Windsor JA, Pullan AJ. High-resolution entrainment mapping of gastric pacing: a new analytical tool. Am J Physiol Gastrointest Liver Physiol. 2010;298(2):G314–G321. doi: 10.1152/ajpgi.00389.2009. [DOI] [PMC free article] [PubMed] [Google Scholar]
- 11.He YH, Ghanem RN, Waldo AL, Rudy Y. An interactive graphical system for automated mapping and display of cardiac rhythms. J. Electrocardiol. 1999 Jul;32(3):225–241. [PubMed] [Google Scholar]
- 12.Shenasa M, Gerhard H, Martin B, Gunter B. Cardiac Mapping. 3rd ed. Hoboken, NJ, USA: Wiley; 2009. p. 544. [Google Scholar]
- 13.Erickson JC, O’Grady G, Du P, Obioha C, Qiao W, Richards WO, Bradshaw LA, Pullan AJ, Cheng LK. Falling-edge, variable threshold (FEVT)method for the automated detection of gastric slow wave events in high-resolution serosal electrode recordings. Ann. Biomed. Eng. 2010 Apr;38(4):1511–1529. doi: 10.1007/s10439-009-9870-3. [DOI] [PMC free article] [PubMed] [Google Scholar]
- 14.Erickson JC, O’Grady G, Du P, Egbuji JU, Pullan AJ, Cheng LK. Automated gastric slow wave cycle partitioning and visualization for high-resolution activation time maps. Ann. Biomed. Eng. 2011 Jan;39(1):469–483. doi: 10.1007/s10439-010-0170-8. [DOI] [PMC free article] [PubMed] [Google Scholar]
- 15.Bull SH, O’Grady G, Cheng LK, Pullan AJ. A framework for the online analysis of multi-electrode gastric slow wave recordings. Conf Proc IEEE Eng Med Biol Soc. 2011;2011:1741–1744. doi: 10.1109/IEMBS.2011.6090498. [DOI] [PMC free article] [PubMed] [Google Scholar]
- 16.Paskaranandavadivel N, O’Grady G, Du P, K Cheng L. Comparison of filtering methods for extracellular gastric slow wave recordings. Neurogastroenterol. Motil. 2013 Jan;25(1):79–83. doi: 10.1111/nmo.12012. [DOI] [PMC free article] [PubMed] [Google Scholar]
- 17.Paskaranandavadivel N, Cheng LK, Du P, O’Grady G, Pullan AJ. Improved signal processing techniques for the analysis of high resolution serosal slow wave activity in the stomach. Conf Proc IEEE Eng Med Biol Soc. 2011;2011:1737–1740. doi: 10.1109/IEMBS.2011.6090497. [DOI] [PMC free article] [PubMed] [Google Scholar]
- 18.Williams A, Taylor F. Electronic Filter Design Handbook. 4th ed. New York, NY, USA: McGraw-Hill; 2006. p. 775. [Google Scholar]
- 19.Rogers JM, Bayly PV, Ideker RE, Smith WM. Quantitative techniques for analyzing high-resolution cardiac-mapping data. IEEE Eng. Med. Biol. Mag. 1998 Jan-Feb;17(1):62–72. doi: 10.1109/51.646223. [DOI] [PubMed] [Google Scholar]
- 20.de Bakker JMT, Wittkampf FHM. The pathophysiologic basis of fractionated and complex electrograms and the impact of recording techniques on their detection and interpretation. Circ. Arrhythm. Electrophysiol. 2010 Apr;3(2):204–213. doi: 10.1161/CIRCEP.109.904763. [DOI] [PubMed] [Google Scholar]
- 21.Kaiser JF. Some useful properties of Teager’s energy operators. Proc. IEEE Int. Conf. Acoust. Speech Signal Process. 1993;3:149–152. [Google Scholar]
- 22.Lammers WJEP, Michiels B, Voeten J, Ver Donck L, Schuurkes JAJ. Mapping slow waves and spikes in chronically instrumented conscious dogs: Automated on-line electrogram analysis. Med. Biol. Eng. Comput. 2008 Feb;46(2):121–129. doi: 10.1007/s11517-007-0294-7. [DOI] [PubMed] [Google Scholar]
- 23.Egbuji JU, O’Grady G, Du P, Cheng LK, Lammers WJEP, Windsor JA, Pullan AJ. Origin, propagation and regional characteristics of porcine gastric slow wave activity determined by high-resolution mapping. Neurogastroenterol. Motil. 2010 Oct;22(10):e292–e300. doi: 10.1111/j.1365-2982.2010.01538.x. [DOI] [PMC free article] [PubMed] [Google Scholar]
- 24.Lammers WJ, Ver Donck L, Stephen B, Smets D, Schuurkes JA. Origin and propagation of the slow wave in the canine stomach: The outlines of a gastric conduction system. Am J Physiol Gastrointest Liver Physiol. 2009 Jun;296(6):G1200–G1210. doi: 10.1152/ajpgi.90581.2008. [DOI] [PubMed] [Google Scholar]
- 25.DeCarlo LT. On the meaning and use of kurtosis. Psychol. Methods. 1997;2(3):292–307. [Google Scholar]
- 26.Lammers WJ, El-Kays A, Arafat K, El-Sharkawy TY. Wave mapping: Detection of co-existing multiple wavefronts in high-resolution electrical mapping. Med. Biol. Eng. Comput. 1995 May;33(3):476–481. doi: 10.1007/BF02510533. [DOI] [PubMed] [Google Scholar]
- 27.Ideker RE, Smith WM, Blanchard SM, Reiser SL, Simpson EV, Wolf PD, Danieley ND. The assumptions of isochronal cardiac mapping. Pacing Clin. Electrophysiol. 1989 Mar;12(3):456–478. doi: 10.1111/j.1540-8159.1989.tb02684.x. [DOI] [PubMed] [Google Scholar]
- 28.Bayly PV, KenKnight BH, Rogers JM, Hillsley RE, Ideker RE, Smith WM. Estimation of conduction velocity vector fields from epicardial mapping data. IEEE Trans. Biomed. Eng. 1998 May;45(5):563–571. doi: 10.1109/10.668746. [DOI] [PubMed] [Google Scholar]
- 29.Gallagher JJ, Gilbert M, Svenson RH, Sealy WC, Kasell J, Wallace AG. Wolff-parkinson-white syndrome. The problem, evaluation, and surgical correction. Circulation. 1975 May;51(5):767–785. doi: 10.1161/01.cir.51.5.767. [DOI] [PubMed] [Google Scholar]
- 30.Josephson ME, Horowitz LN, Farshidi A, Spear JF, Kastor JA, Moore EN. Recurrent sustained ventricular tachycardia. 2. Endocardial mapping. Circulation. 1978 Mar;57(3):440–447. doi: 10.1161/01.cir.57.3.440. [DOI] [PubMed] [Google Scholar]
- 31.Lin X, Chen JZ. Abnormal gastric slow waves in patients with functional dyspepsia assessed by multichannel electrogastrography. Am J Physiol Gastrointest Liver Physiol. 2001 Jun;280(6):G1370–G1375. doi: 10.1152/ajpgi.2001.280.6.G1370. [DOI] [PubMed] [Google Scholar]
- 32.O’Grady G, Du P, Paskaranandavadivel N, Angeli TR, Lammers WJEP, Asirvatham SJ, Windsor JA, Farrugia G, Pullan AJ, Cheng LK. Rapid high-amplitude circumferential slow wave propagation during normal gastric pace making and dysrhythmias. Neurogastroenterol. Motil. 2012 Jul;24(7):e299–e312. doi: 10.1111/j.1365-2982.2012.01932.x. [DOI] [PMC free article] [PubMed] [Google Scholar]
- 33.Farajidavar A, O’Grady G, Rao SMN, Cheng LK, Abell TL, Chiao J-C. Aminiature bidirectional telemetry system for in vivo gastric slow wave recordings. Physiol. Meas. 2012 Jun;33(6):N29–N37. doi: 10.1088/0967-3334/33/6/N29. [DOI] [PMC free article] [PubMed] [Google Scholar]
- 34.Angeli TR, O’Grady G, Du P, Paskaranandavadivel N, Pullan AJ, Bissett IP, Cheng LK. Circumferential and functional re-entry of in vivo slow-wave activity in the porcine small intestine. Neurogastroenterol. Motil. 2013 May;25(5):e304–e314. doi: 10.1111/nmo.12085. [DOI] [PMC free article] [PubMed] [Google Scholar]
Associated Data
This section collects any data citations, data availability statements, or supplementary materials included in this article.


