
Fig. 1.
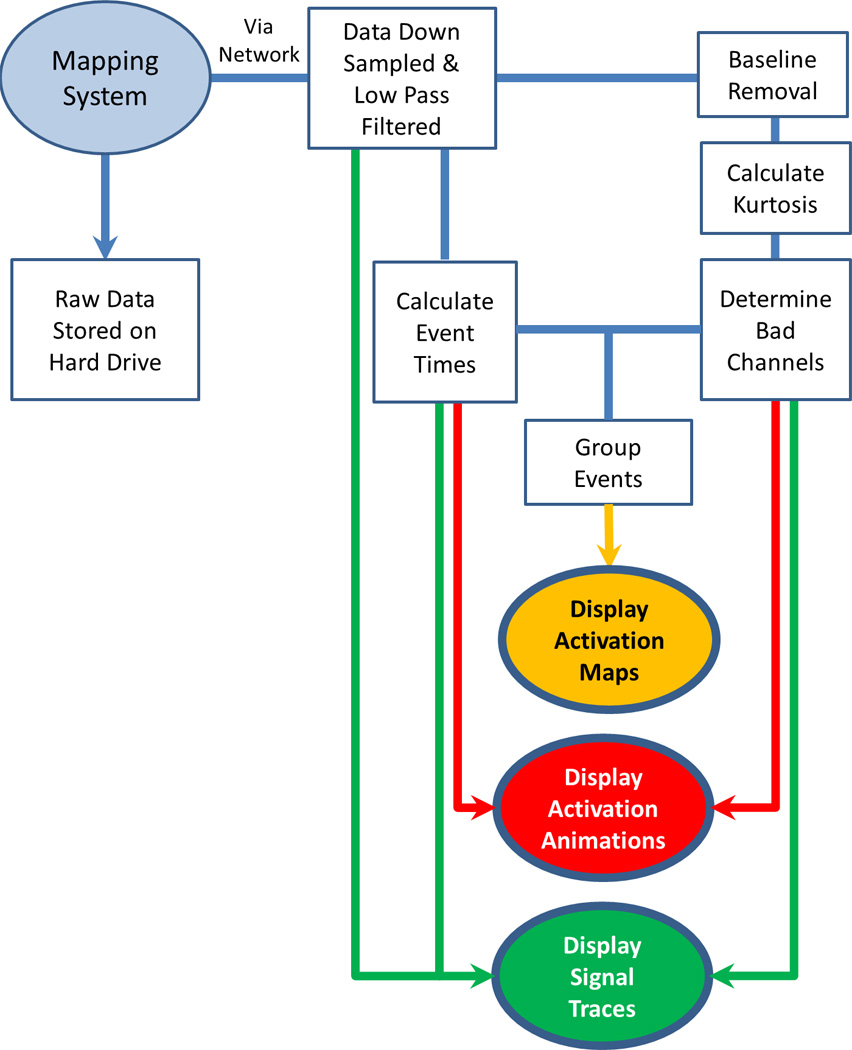
Flowchart illustrating the system developed to process online HR slow wave data. The signal input is shown in a light oval, the processing modules in rectangles, and the outputs in dark ovals.
Official websites use .gov
A
.gov website belongs to an official
government organization in the United States.
Secure .gov websites use HTTPS
A lock (
) or https:// means you've safely
connected to the .gov website. Share sensitive
information only on official, secure websites.
Flowchart illustrating the system developed to process online HR slow wave data. The signal input is shown in a light oval, the processing modules in rectangles, and the outputs in dark ovals.