
Fig. 3.
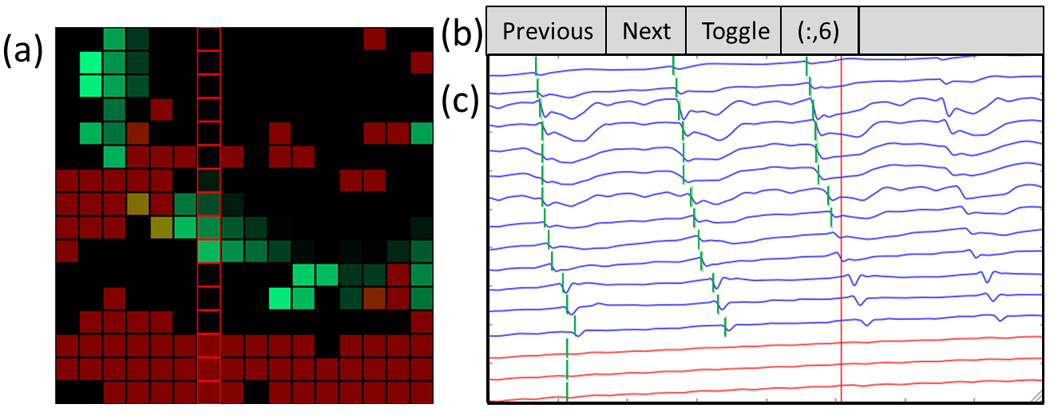
Screenshot of the interface developed to enable online HR mapping. The dataset include multiple low SNR channels, as well as a patch of electrodes over a quiescent region of the stomach (i.e., bottom three rows of the array). (a) Animation window. The wave front is propagating from top-right to bottom left (see also the corresponding animation Figure3_animation.mp4, available in the online supplementary material). Reliable channels (anticipated to contain TP data) are colored green, while unreliable channels (anticipated to contain FP data) are red. (b) User controls. Users can “toggle” to view a column or row of electrodes, and change their selection to the next or previous row or column. (c) Signal traces from the user-selected electrograms with reliable channels (blue), unreliable channels (red), and detected activation times (vertical green bars). The vertical red line indicates the point in time currently being animated. Column of red squares outline electrodes are shown in the signal traces.