
Fig. 7.
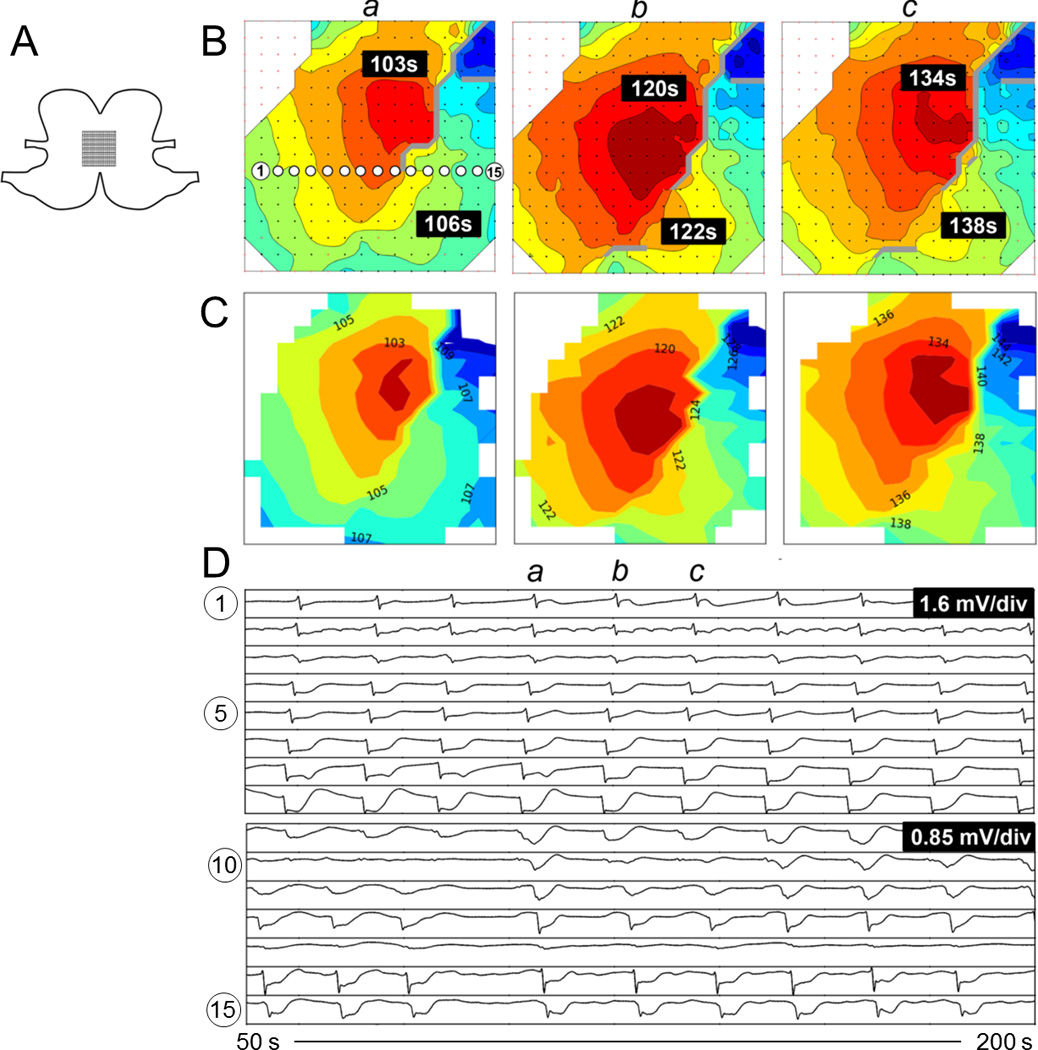
Comparison of activation maps produced from ectopic pacemaking with looping propagations. A. Position of the electrode array spanning the anterior and posterior surfaces across the greater curvature. B. Offline activation maps from three consecutive waves (a-c). The isochronal intervals are 1 s. C. Corresponding online activation maps. D. Signal traces from 15 electrodes with locations as indicated in B(a). Animation of the corresponding time sequence comparing the online and offline analysis is presented in Figure7_animation.mp4.