Figure 5.

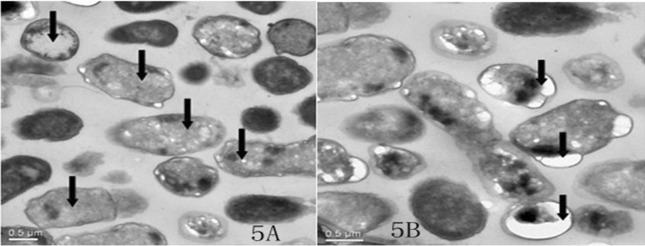
TEM graph of Escherichia coli exposed to MIC value of α-terpineol for 4 h. Cytoplasm had lost and the most cells stained slightly (A, x 25000, arrows). Plasmolysis and bubble appeared (B, x 25000, arrows).

TEM graph of Escherichia coli exposed to MIC value of α-terpineol for 4 h. Cytoplasm had lost and the most cells stained slightly (A, x 25000, arrows). Plasmolysis and bubble appeared (B, x 25000, arrows).