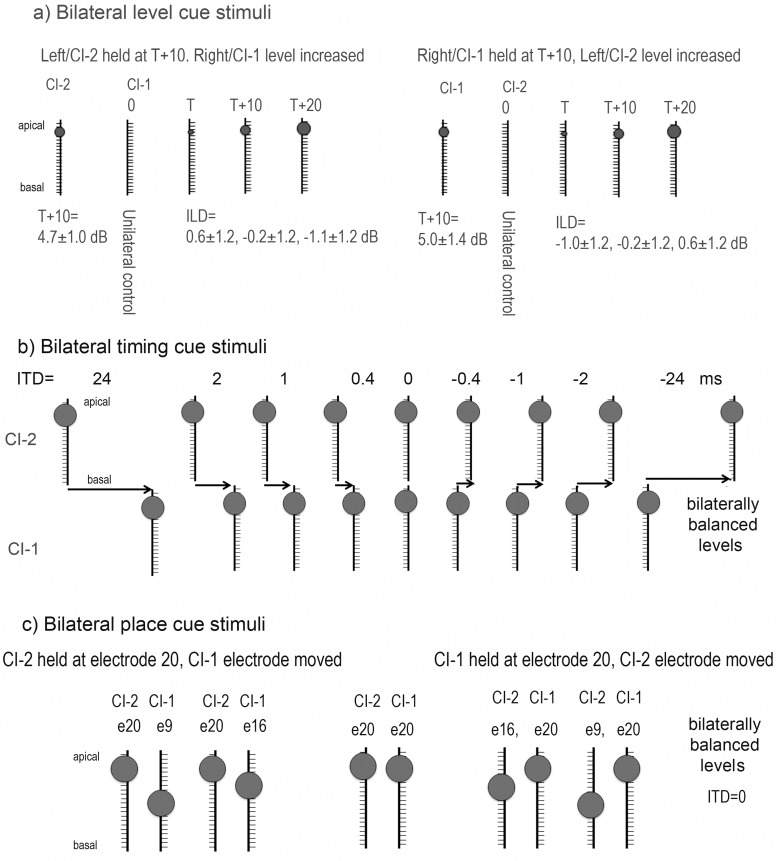
Fig 2. Schematic diagrams of experimental conditions.
a: Bilateral level cues were presented by either holding stimulus levels constant in the left normal ear/CI-2 and increasing level in the right normal ear/CI-1 or the reverse. Increases in stimulus level are represented by the size of the circle. The circles are fairly small as levels were presented at threshold levels (T) or slightly above (T+10 or 20 dB or CU). Unilateral control conditions were also presented (T+10 in either right ear/CI-1 or left ear/CI-2 with 0 in the opposite side). Mean (±1 SD) cochlear implant unilateral stimulation levels (T+10 in each ear) and presented ILDs are shown. b) Bilateral input containing interaural/implant timing differences are shown. These were presented from e20 on both implants at levels which were comfortably loud and behaviorally balanced as shown by the larger circles at the apical end of the schematic cochlear implant array. c) Bilateral input presented at different places along the electrode array (for CI users only). Levels were comfortably loud and behaviorally balanced. The presentations were simultaneous (ITD = 0).

