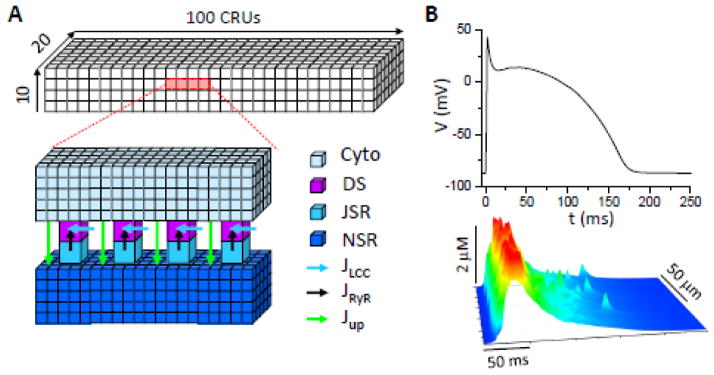
Figure 1. Computational model.

A. Schematic plot of the CRU network model. A full model contains 10×20×100 CRUs. A CRU contains a network SR (NSR) space, a junctional SR (JSR) space, a dyadic space (DS), and a cytosolic (Cyto) space. These spaces are coupled via SR Ca release (Jrel), uptake (Jup), and Ca diffusion. The CRU network is coupled via Ca diffusion in cytosol and NSR. B. An action potential and a line scan of cytoplasmic free [Ca]i under control conditions at PCL=500 ms. We set [Na]i= 9 mM as normal [Na]i. This action potential was used as the voltage wave form for all simulations under action potential clamp conditions.
