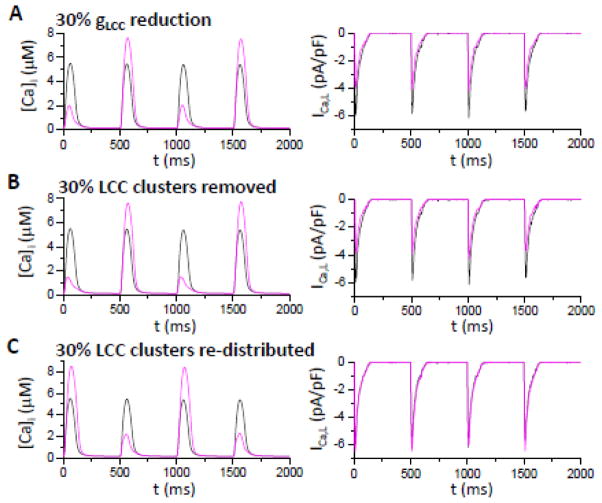
Figure 3. Effects of LCC distribution on Ca alternans.
Shown are whole-cell cytosolic free [Ca]i (left) and whole-cell ICa,L (right). Black trace in each panel corresponds to normal LCC conductance and distribution, and purple traces are those after LCC conductance or distribution are altered. A. LCC single channel conductance reduced by 30%. B. 30% of the LCC clusters removed from the cell. C. 30% of the LCC clusters removed, but their LCCs re-distributed to the other CRUs with LCC clusters such that the total number of LCCS remain the same. [Na]i=14 mM.

