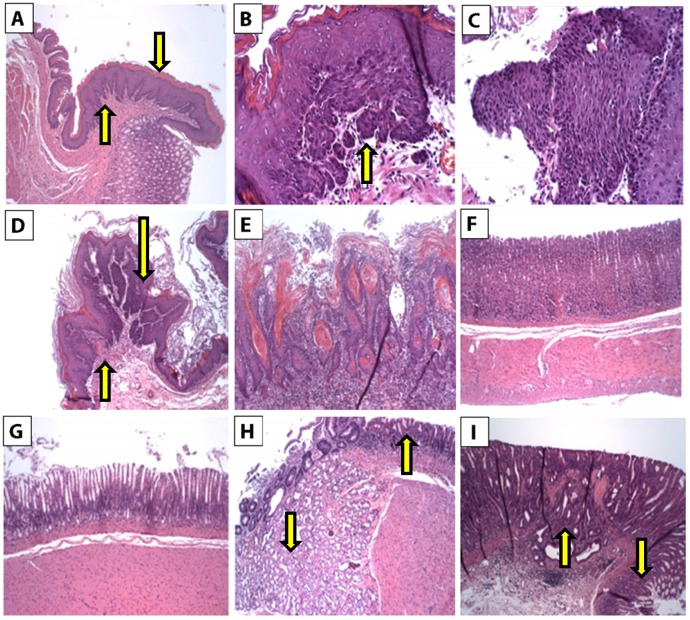
Figure 2.
H&E histopathology staining from esophageal and gastric tissues. The foci of dysplasia and carcinoma are patchy and involved 1 to 2 mm of the tissue sections. (A) Section of a control rat's esophageal tissue, there is hyperkeratosis (down arrow) and squamous hyperplasia (up arrow) (2X). (B-E) Sections from esophageal mucosa from carcinogen-treated rats. (B) Section of esophagus showing a focus of mild squamous dysplasia (up arrow) (10X). (C) Section of esophagus showing severe squamous dysplasia (10X). (D) Section of esophagus showing a focus of mild, moderate, and severe squamous dysplasia (down arrow) and a focus of squamous cell carcinoma (up arrow) (4X). (E) Section of esophagus showing invasive well-differentiated keratinizing squamous cell carcinoma (10X). (F) Section of the stomach body of a control rat (4X). (G) Section of the antrum of the stomach of a control rat (4X). (H,I) Sections from gastric tissues of carcinogen-treated rats. (H) Section of antrum area showing mild dysplasia of glands (up arrow) and hyperplastic mucinous glands (down arrow) (4X). (I) Section of the body showing high-grade glandular dysplasia (down arrow) and invasive adenocarcinoma (up arrow) (4X).

