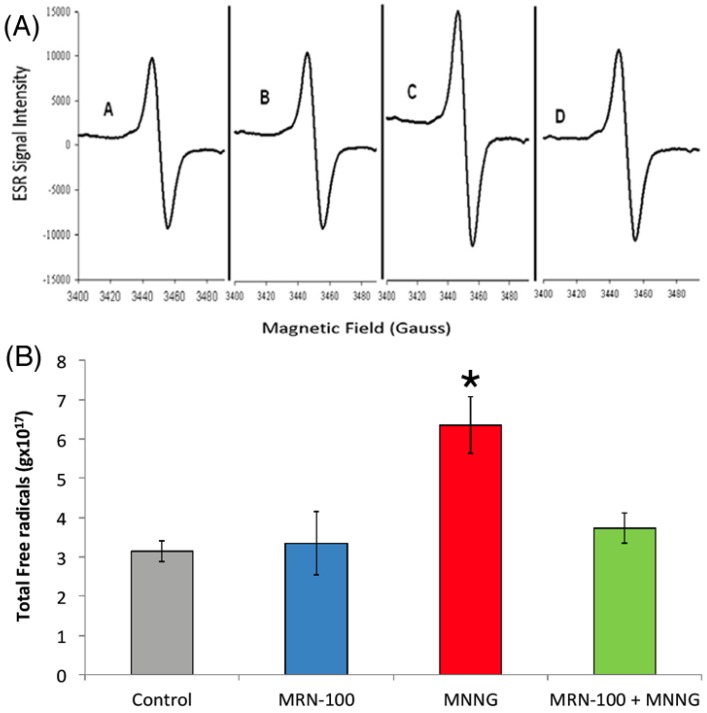
Figure 6.
Blood total free radicals in rats treated with MNNG and MNNG+MRN-100 for 33 weeks. (A) Total free radical levels were analyzed by ESR spectra of lyophilized blood samples. (B) Levels of total free radicals in rats under different treatment conditions. * p<0.01 compared to control and other groups. Each bar represents the mean ± SE of 6 rats/group.

