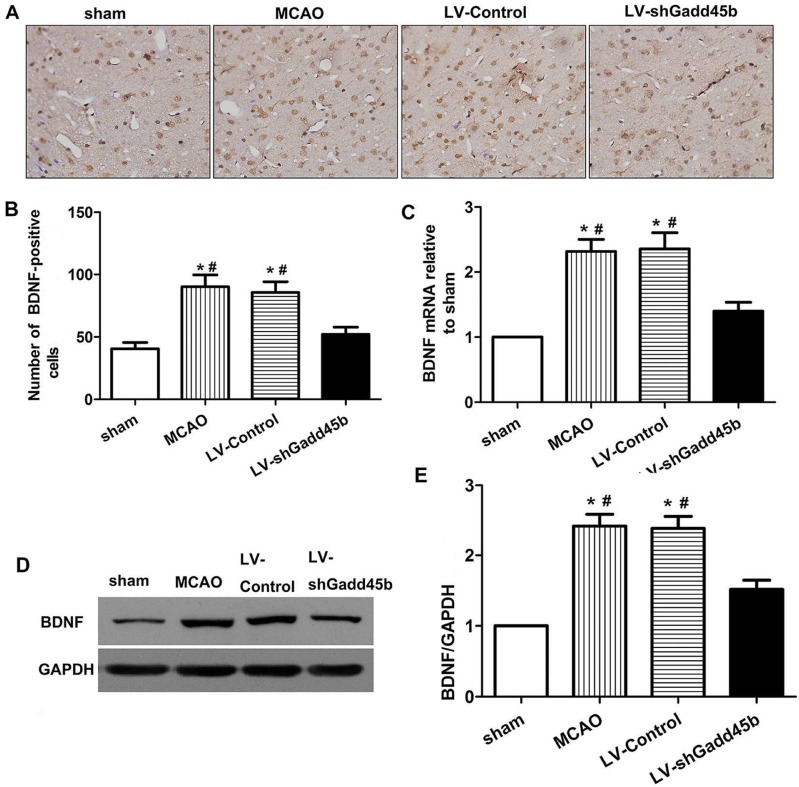
Figure 6.
Gadd45b-RNAi treatment suppressed BDNF expression 24 h after MCAO. (A) Immunohistochemistry for BDNF (original magnification 400×). Images are taken from ipsilateral ischemic penumbra. (B) The bar graph reflects the BDNF-positive cells in each group. (C) The bar graph reflects the BDNF mRNA expression in each group. Data were expressed as fold of sham. (D) Western blot assay of the BDNF expression in each group. (E) The bar graph reflects the BDNF protein expressions in each group. Data were expressed as fold of sham. (*p<0.01, compared with sham group, #p<0.05, compared with LV-shGadd45b group).

