
FIG 11.
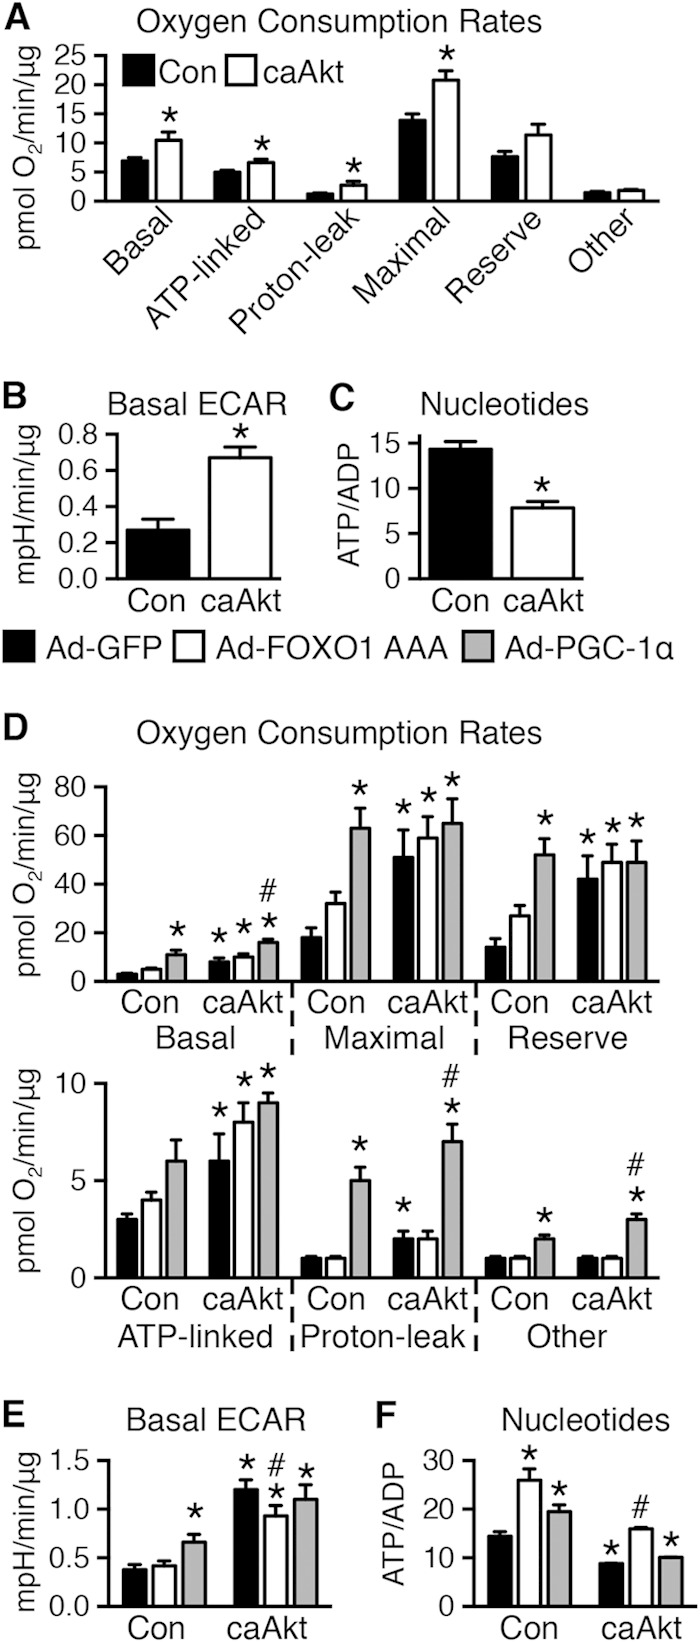
In vitro expression of caAkt alters cellular bioenergetics in myotubes. (A and B) Seahorse cellular bioenergetics analysis of oxygen consumption rates (OCR) (A) (further details in Materials and Methods) and extracellular acidification rates (ECAR) (B) in control or caAkt-transduced C2C12 myotubes as in Fig. 10 (n = 10 to 11). (C) HPLC quantification of the nucleotides ATP and ADP in control or caAkt-transduced C2C12 myotubes (n = 6). Data shown as mean ± SEM. *, P < 0.05 versus Con. (D and E) Seahorse cellular bioenergetics analysis of OCR (D) and ECAR (E) in C2C12 myotubes as described above following Ad-PGC-1α or Ad-FOXO1 AAA infection compared to Ad-GFP (n ≥ 4). (F) HPLC quantification of the nucleotides ATP and ADP in C2C12 myotubes as described for panels D and E (n = 3). Data shown as mean ± SEM. *, P < 0.05 versus Ad-GFP Con. #, P < 0.05 versus Ad-GFP caAkt.