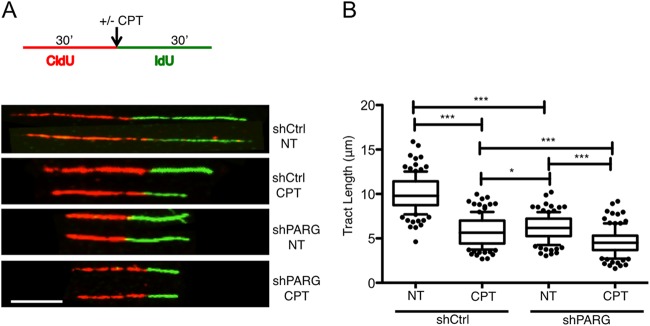
FIG 2.
PARG depletion slows down replication fork progression. (A) Schematic experimental conditions for DNA replication track analysis. shCtrl and shPARG cells were labeled with CldU and IdU as indicated. Red and green identify CldU- and IdU-containing tracks, respectively. CPT (25 nM) was optionally added concomitantly with the second label. Representative DNA fiber tracks from shCtrl and shPARG cells with or without CPT treatment are shown below the schematic. Scale bar, 5 μm. (B) Statistical analysis of IdU tract length measurements from shCtrl or shPARG cells. Data represent relative lengths of IdU tracts (green) synthesized after mock (NT) or CPT (25 nM) treatment. At least 125 tracks were scored for each data set. Whiskers indicate the 10 and 90 percentiles. Statistical tests were performed using Mann-Whitney analysis: *, P = 0.0206; ***, P < 0.0001. Very similar results were obtained in two independent experiments.

