
FIG 5.
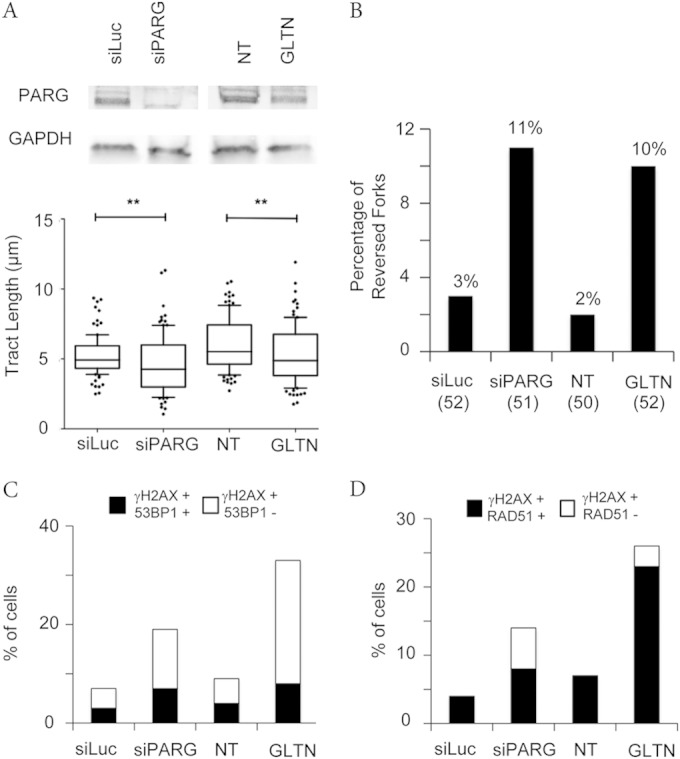
PARG inactivation by different methods leads to replication interference and DDR marks. (A) PARG levels after siRNA-mediated depletion were detected by immunoblotting. GAPDH (glyceraldehyde-3-phosphate dehydrogenase) was used as the loading control. DNA fiber experiments were performed as in Fig. 2A (no CPT treatment), but with a 20-min labeling time. Data represent the results of statistical analysis of IdU tract (green in Fig. 2A) length measurements in U2OS cells 72 h after siLuc or siPARG transfection or upon mock treatment (NT) or 20 μM gallotannin (GLTN) treatment for 24 h. At least 100 tracks were scored for each data set. Whiskers indicate the 10 and 90 percentiles. Statistical tests were performed using Mann-Whitney analysis; **, P < 0.001. (B) Frequency of fork reversal in U2OS cells 72 h after siLuc or siPARG transfection or upon mock treatment (NT) or 20 μM gallotannin (GLTN) treatment for 24 h. The numbers of analyzed molecules are indicated in parentheses. (C and D) Quantification plots to show the percentage of γH2AX-positive cells also positive for 53BP1 and RAD51, respectively, in U2OS cells 72 h after siLuc or siPARG transfection or upon mock treatment (NT) or 20 μM gallotannin (GLTN) treatment for 24 h.