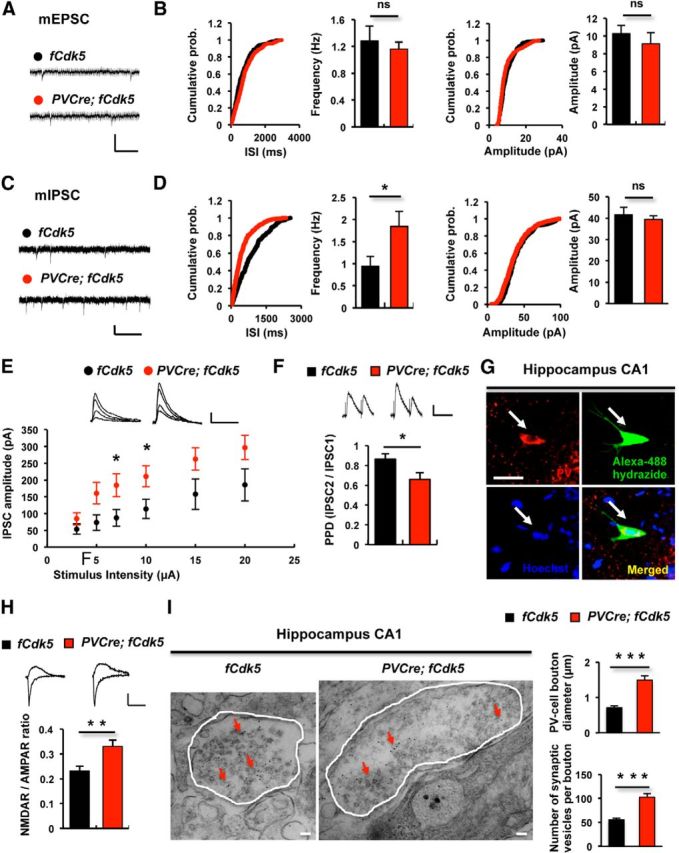
Figure 5.

PVCre;fCdk5 mice display increased inhibitory neurotransmission. A–F, Whole-cell recordings from pyramidal cells in the CA1 area of acute hippocampal slices from control (fCdk5) and PVCre;fCdk5 mice. A, Representative traces of mEPSCs from control and PVCre;fCdk5 mice. Calibration: 20 pA, 200 ms. B, Cumulative probability distribution histograms and bar graphs showing average values of mEPSC frequency or amplitude from control (3 animals, 9 cells) and PVCre;fCdk5 mice (3 animals, 9 cells) C, Representative traces of mIPSCs from control and PVCre;fCdk5 mice. Calibration: 25 pA, 500 ms. D, Cumulative probability distribution histograms and bar graphs showing average values of mIPSC frequency and amplitude in control (4 animals, 7 cells) and PVCre;fCdk5 (5 animals, 9 cells) mice. E, IPSCs recording from control (3 animals, 9 cells) and PVCre;fCdk5 (3 animals, 11 cells) mice. IPSCs amplitude plotted against stimulus intensity is shown. Calibration: 50 pA, 50 ms. F, Paired-pulse depression (PPD = IPSC2/IPSC1; interstimulus interval, 100 ms) of IPSCs was measured in control (3 animals, 5 slices) and PVCre;fCdk5 (3 animals, 7 slices) mice. Calibration: 20 pA, 100 ms. G, PV interneurons were identified based on their morphological features and later confirmed by filling with Alexa Fluor 488 hydrazide combined with anti-PV antibody labeling. Scale bar, 15 μm. H, NMDAR- or AMPAR-mediated current was measured at PV interneurons in hippocampal CA1 region in control (3 animals, 8 cells) and PVCre;fCdk5 (3 animals, 9 cells) mice. Calibration: 50 pA, 50 ms. I, Synaptic boutons of PV interneurons were identified in control and PVCre;fCdk5 mice by preembedding immunogold labeling transmission electron microscopy in ultrathin hippocampal sections. Diameter of all unequivocally identified PV boutons and number of synaptic vesicles per bouton were measured in corresponding hippocampal sections in CA1 stratum pyramidale and stratum radiatum from control and PVCre;fCdk5 mice (3 animals and ∼100 boutons per group). Scale bars, 100 nm. Red arrows, PV/Protein A gold particles; white contours, PV bouton outlines; black, control mice; red, PVCre;fCdk5 mice; ns, not significant. *p < 0.05, **p < 0.01, ***p < 0.001; error bars indicate SEM.
