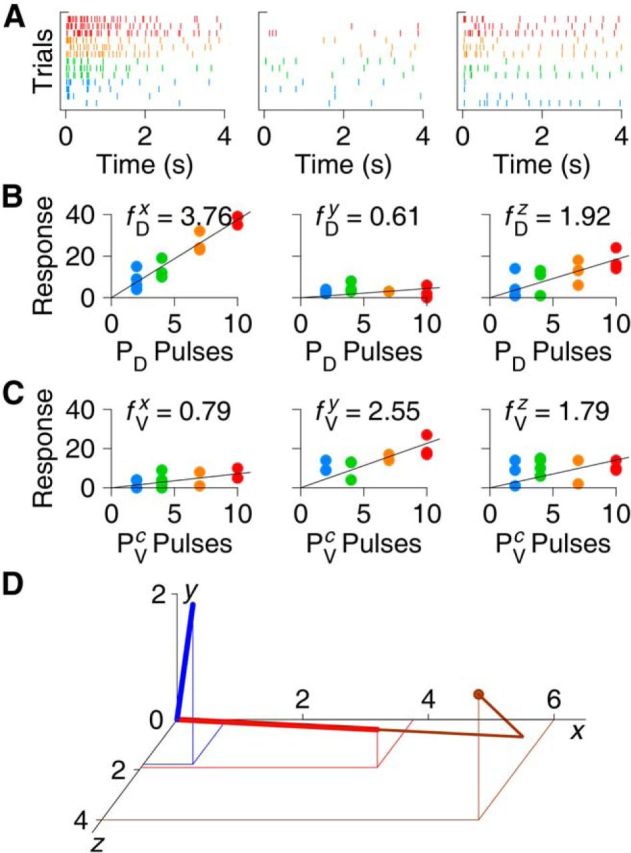
Figure 3.

Illustration of the calculation of canonical responses. A, Raster plot of responses to PD stimulation with 2, 4, 7, and 10 pulses (blue, green, orange, and red, respectively) in three arbitrarily chosen cells simultaneously recorded in one ganglion. B, Response count (number of spikes detected in first 4 s) as a function of number of pulses in the stimulus; same three cells as in A. Arbitrarily calling these cells “x,” “y,” and “z,” we calculate the x-, y-, and z-components of the canonical dorsal response vector f⃗D based on these graphs. C, Response count for stimulation to the contralateral PV cell. The x-, y-, and z-components of the canonical ventral response vector f⃗V are based on these graphs. D, Visualization of the canonical dorsal (red) and ventral (blue) responses in three dimensions with projection down to the x,z plane. Also shown is the decomposition of a response in a single trial to a train of two pulses to PD as a scalar multiple of f⃗D plus a residual (brown). This illustration is based on a small subset of the data from one experiment; the full dataset obtained from one experiment comprises recordings from ∼10–20 neurons, which would yield rather high dimensional graphs.
