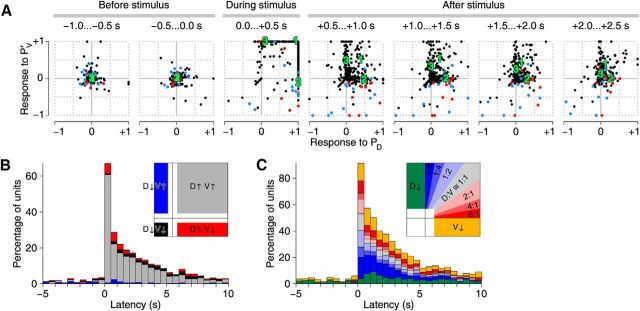
Figure 5.
Time evolution of responses to PD and PVc stimulation. A, Responses (i.e., baseline-subtracted firing rates) of 367 isolated putative neurons (dots) in 35 ganglia to stimulation of a PD neuron (x-axis) or the contralateral PV neuron (PVc) (y-axis). Panels represent consecutive 0.5-s-wide windows. Units positively identified as DE-3 neurons ipsilateral to the PD neuron are colored red (n = 11); contralateral blue (n = 14). B, Units that responded to both PD and PVc stimulation classified by the signs of their responses as a function of time. Red represents units with firing rate upregulated by PD stimulation and downregulated by PVc stimulation. Black represents units downregulated by both. Gray represents units upregulated by both. Blue represents units downregulated by PD stimulation and upregulated by PVc stimulation. (Numbers do not add up to 100% because only units that, in a given time window, had firing rates >0.5 SD different from their baseline in both PD and PVc conditions are included in this graph.) Inset, How the various regions in the panels in A are represented in B. White indicates regions not represented. C, Units that responded to either PD or PVc stimulation with a firing rate increase classified by the ratio of those increases (“D:V”). (Numbers do not add up to 100% because only units are included that, in a given time window, had firing rates >1 SD above their baseline in at least one of the two stimulus conditions.) Inset, How the various regions in the panels in A are represented in C. White indicates regions not represented.

