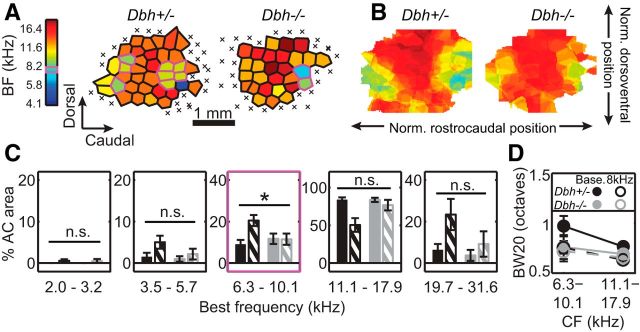
Figure 3.
Effect of developmental sound exposure on frequency responses in Dbh+/− and Dbh−/− mice. A, As in Figure 2C–E, representative BF maps for individual 8 kHz-exposed mice. Magenta outline highlights multiunits with BFs at 8 kHz ± 0.35 octaves. Magenta box on color bar highlights frequency of developmental exposure. B, As in Figure 2F,G, group average BF maps for 8 kHz-exposed mice. Cell color represents the average BF for all constituent maps that have core multiunits at that normalized position. Color scale as in A. C, Percentage area of core auditory cortex (AC area) tuned within different frequency bins. Each bin contains six tested frequencies, spanning ∼0.7 octaves. Color scheme is same as in Figure 1B. Error bars represent means ± SEM. Asterisk indicates significant genotype × experience interaction, p < 0.05. D, Bandwidth at 20 dB above threshold (BW20), for multiunits with characteristic frequencies (CFs) within the specified ranges. “Base.” refers to baseline group; “8kHz” refers to 8 kHz-exposed group. Error bars represent means ± SEM.

