Figure 5.
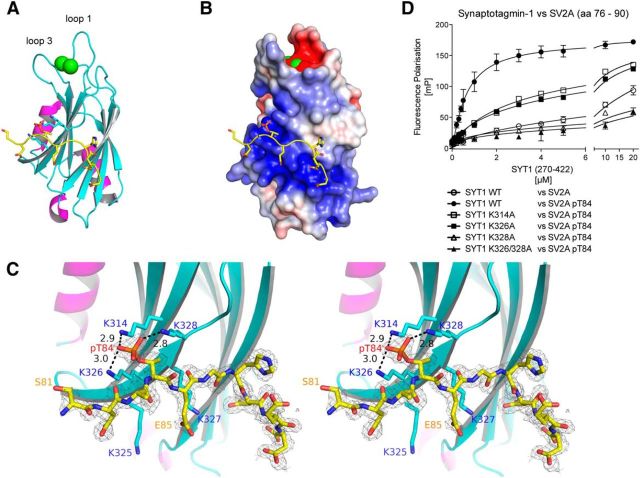
Crystal structure of Thr84 phosphorylated Cluster-2 peptide bound to synaptotagmin-1 C2B domain. A, A ribbon diagram of the synaptotagmin-1 C2B domain (residues 270–422) bound to a peptide encompassing the Cluster-2 region of SV2A (residues 81–90) that is phosphorylated at Thr84 (PDB entry 4v11). The synaptotagmin-1 C2B domain is shown with β strands colored in cyan, helices in magenta, and loops in gray. The backbone of the SV2A peptide, binding at the polybasic region, is colored in yellow. The side chains of residues of the polybasic region interacting with the SV2A peptide are shown as stick models. The two Ca2+ ions, binding between loops 1 and 3, are shown as green spheres. B, Electrostatic surface representation of synaptotagmin-1 with the bound SV2A peptide. The negatively charged phosphate group of the SV2A peptide is binding to the positively charged surface area at the polybasic region of synaptotagmin-1. Negative charge (acidic) is shown in red and positive charge (basic) in blue. The electrostatic map is contoured from −5 to 5 kTe. C, Stereo-image and close-up analysis of the pocket on the C2B domain that interacts with Thr84 phosphorylated residue. The three highly conserved surface-exposed Lys residues on synaptotagmin-1 (Lys314, Lys326, and Lys328) interact with Thr84 of SV2A, and distances between the ε-amino groups of the lysine residues and the phosphate group of phosphorylated Thr84 are shown in angstroms. These Lys residues are distributed on anti-parallel β sheets 3 and 4, and their side chains form a specific binding pocket that precisely accommodates the phosphorylated Thr84 residue. The 2mFo-dFc map, before manual building of the peptide model and refinement, is shown as gray mesh and was contoured at 1σ within 2 Å of the SV2A peptide. D, Fluorescence polarization analysis of WT and indicated Lys substitution mutants (K314A, K326A, K328A, and K326A/K328A) of synaptotagmin-1 C2B domain and peptide encompassing Cluster-2 region of SV2A (residues 76–90), which was either phosphorylated at Thr84 or unphosphorylated as a negative control. Data points and error bars represent mean ± SD (n = 3), and similar results were obtained in at least two separate experiments for all data shown in this figure.

