Figure 1.
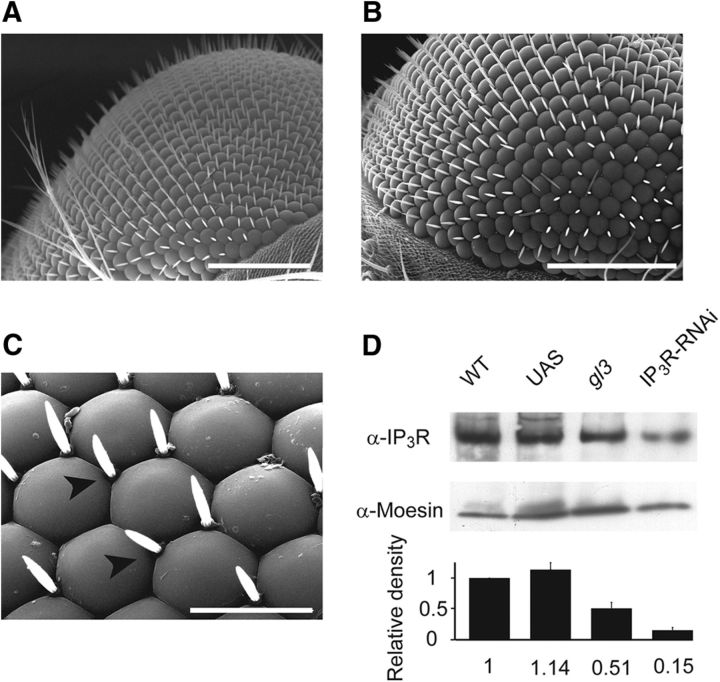
IP3R-RNAi retinae show virtually normal eye morphology but reduced IP3R expression levels. A–C, SEM comparing eye of IP3R-RNAi (B, C) and WT flies (A). Scale bars: A, B, 100 μm; C, 20 μm. Arrowheads point to corneal hairs. D, Western blot analysis of isolated retinae (20–30 retinae for each lane) of IP3R-RNAi fly using α-IP3R. The expression levels of IP3R in IP3R-RNAi retinae are compared with its expression levels in isolated retinae of WT, P[UAS:IP3R-RNAi] (UAS), and gl3 mutant (lacking the photoreceptor cells). Relative protein amounts were quantified from band intensities. The density of each lane was divided by the density of α-Moesin (middle row) and calculated as a percentage of WT flies for each experimental run. Bottom, A histogram presenting the average of three independent experiments (mean ± SEM, n = 3); no significant difference was found between WT and UAS, (t test, p = 0.140), but a significant difference was found between WT and gl3 (t test, p = 0.037) and between WT and IP3R-RNAi (t test, p = 0.0029).

