Figure 2.

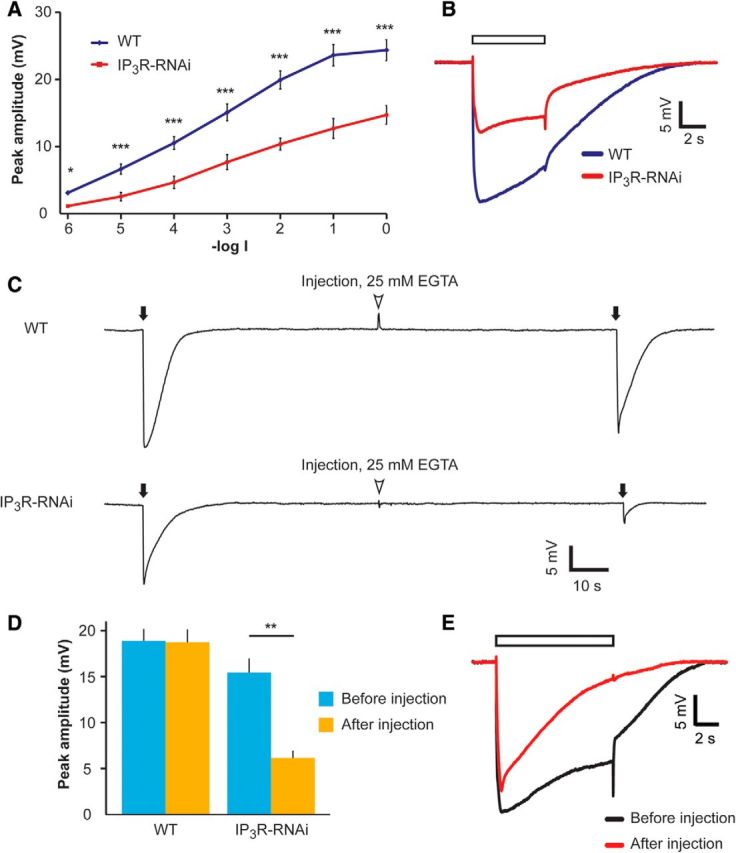
IP3R-RNAi flies show reduced ERG response to light, which was further reduced at low external Ca2+, in vivo. A, Intensity–response (V-logI) curve of peak ERG response amplitudes. The different curves were measured from WT and IP3R-RNAi flies in response to 5 s lights (mean ± SEM, t test, *p < 0.05, ***p < 0.001; n = 10). B, Representative ERG traces in response to a light pulse applied to IP3R-RNAi and WT flies. ERG traces used in A at -log1 light intensity. The open box is the light monitor. C, Reduced ERG amplitude in response to light flash at low extracellular Ca2+. Top, Responses to brief saturated flashes (filled arrows) before and after pressure injection of EGTA-containing solution (arrowheads). Bottom, The same experimental paradigm was repeated in the IP3R-RNAi fly. D, A histogram summarizing the experiments presented in C. A comparison of the response to light flash between WT and IP3R-RNAi (mean ± SEM, t test, p = 0.470 and p = 0.0016 before and after EGTA injection, respectively; n = 10). E, Superimposed ERG traces from a WT fly in response to prolonged light pulse (used in A and B) before (black) and after (red) EGTA injection.
