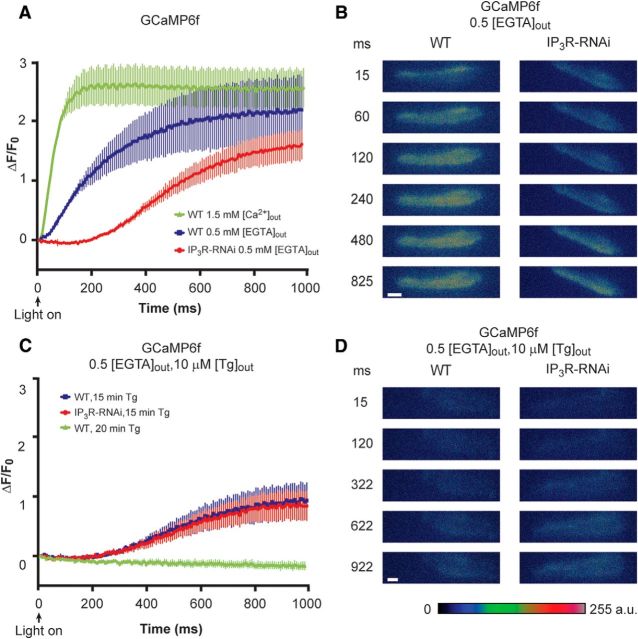
Figure 3.
Reduced light-induced intracellular Ca2+ elevation in intact photoreceptors of IP3R-RNAi flies as measured by GCaMP6f fluorescence. A, Measurements of GCaMP6f fluorescence revealing the kinetics of light-induced increase in cytosolic [Ca2+]. The ordinate plots ΔF/F0 (see Materials and Methods) as a function of time in GCaMP6f flies on WT background at 1.5 mm external [Ca2+] (green) and at 0 (0.5 mm [EGTA]) external [Ca2+] (blue) and in GCaMP6f flies on IP3R-RNAi background at 0 (0.5 mm [EGTA]) external [Ca2+] (red). The plotted curves are means ± SEM. To quantify the difference between the blue and red curves, we compared the difference in fluorescence intensity at 60 and 300 ms of the blue and red curves and found that IP3R-RNAi flies expressing GCaMP6f at 0 extracellular Ca2+ (red) revealed a significant smaller increase of Ca2+ elevation in IP3R-RNAi flies relative to WT flies (t test, p = 0.0098, p = 0.0084 at 60 and 300 ms after light onset, respectively; n = 10). Because of the high affinity of GCaMP6f to Ca2+ (Kd of ∼170 nm) and the large Ca2+ influx at 1.5 mm [Ca2+]out, the Ca2+ indicator reached saturation at the time of maximal fluorescence and only the initial rise of the curves should be considered. B, A time series of whole ommatidia images of control (WT background at 0 external Ca2+) and IP3R-RNAi ommatidia, showing the fluorescence of the GCaMP6f during light stimulation. Scale bar, 10 μm. C, No difference was found between Ca2+ released from internal stores of control and IP3R-RNAi after store depletion by Tg. Measurements of GCaMP6f fluorescence at 0 external Ca2+ (0.5 mm [EGTA]) following 15 min of prior incubation in standard extracellular solution (1.5 mm [Ca2+]) including 10 μΜ Tg in WT (blue) and in IP3R-RNAi backgrounds (red). Incubation of >20 min with Tg of ommatidia from GCaMP6f on WT background flies abolished the increase in fluorescence (green). Tg was also included in the 0 external Ca2+ solution during the fluorescent measurement (n = 10). D, A time series of ommatidia images of control and IP3R-RNAi at the conditions of C, showing the fluorescence of the GCaMP6f during light stimulation. Scale bar, 10 μm.

