Figure 4.

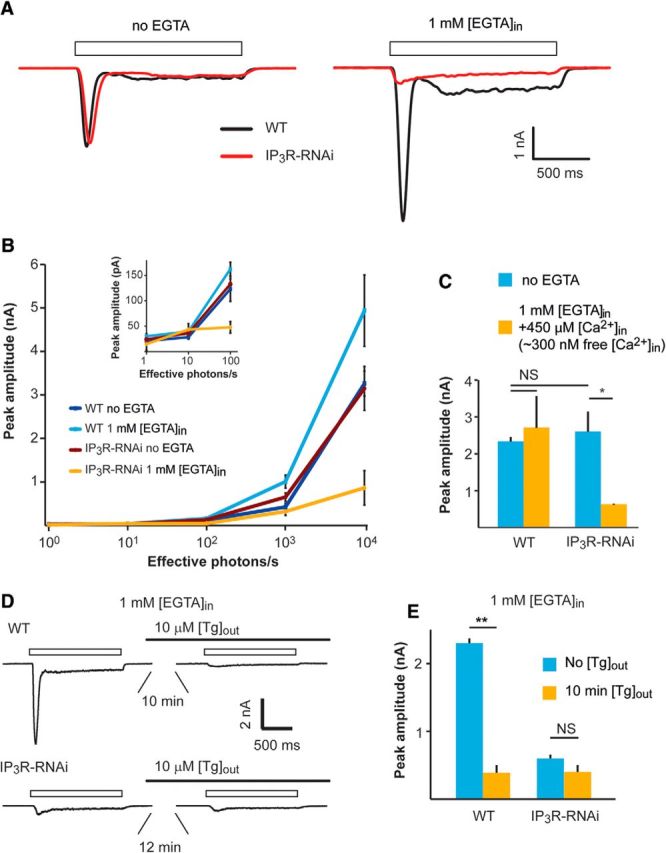
A–C, Patch-clamp whole-cell recordings showing reduced responses to light of IP3R-RNAi photoreceptors when Ca2+ is buffered by EGTA in the pipette solution. A, Representative traces from whole-cell patch-clamp recordings with and without 1 mm [EGTA] added to the pipette solution. Open boxes represent the duration of light pulses. B, Intensity–response relationship of WT and IP3R-RNAi with and without 1 mm EGTA added into the pipette solution as indicated. Inset, The initial graph of B at higher magnification. C, A histogram comparing light responses to a constant light intensity of WT and IP3R-RNAi photoreceptors with standard intracellular solution and when the solution contained ∼300 nm free Ca2+ (mean ± SEM, t test, p = 0.045; n = 5). D, E, Functional Ca2+ pump at the internal Ca2+ stores is required for normal light response while Ca2+ pump inhibition by Tg mimicked the phenotype of IP3R-RNAi phenotype. D, Representative whole-cell recordings of current traces obtained from WT (top) and IP3R-RNAi photoreceptors (bottom), before and after prior incubation (10 min) of the cells in standard bath solution (1.5 mm [Ca2+]) containing 10 μm [Tg]. Solid and open bars represent the time of Tg application and the light monitor, respectively. E, Histograms comparing the peak amplitude of the light-induced current of WT and IP3R-RNAi photoreceptors before and after 10 min of incubation with Tg (mean ± SEM, t test, p = 0.0015; n = 5).
