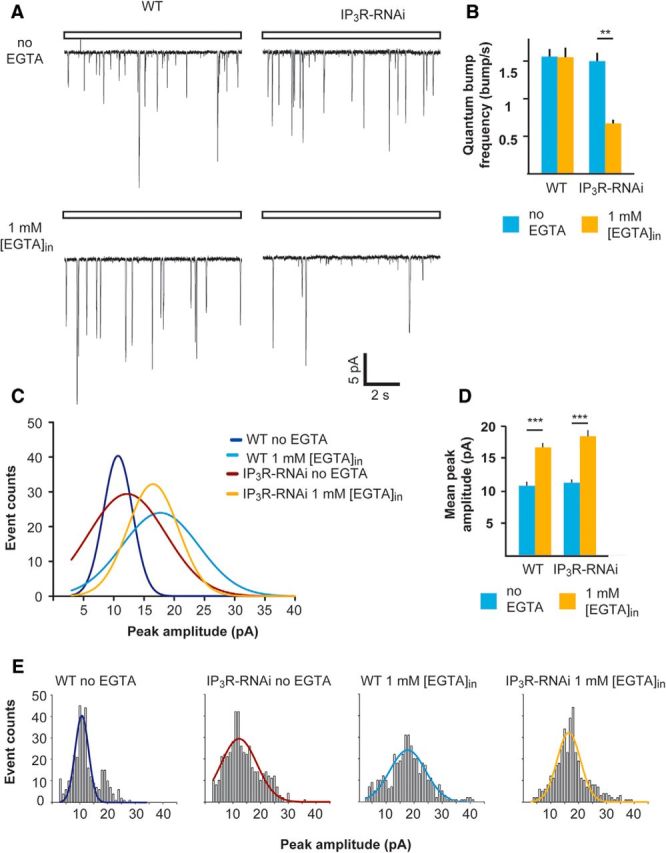
Figure 5.

The frequency but not amplitude of single-photon responses was reduced significantly in IP3R-RNAi flies compared with WT flies when the pipette solution was buffered with EGTA. A, Representative traces of unitary current responses to single photons (quantum bumps) of WT and IP3R-RNAi ommatidia recorded with standard pipette solution (top) or with 1 mm [EGTA] added (bottom). B, A histogram comparing the quantum-bump frequency of WT and IP3R-RNAi photoreceptors with or without EGTA in the recording pipette (mean ± SEM, t test, p = 0.0058; n > 300 bumps for each column, n = 4). C, Distributions of quantum-bump amplitudes. The Gaussians that fit the histograms of quantum-bump amplitude distribution in E (n > 300 for each histogram, with and without EGTA in the pipette solution). D, A histogram comparing the mean quantum-bump amplitudes of WT and IP3R-RNAi with or without EGTA in the recording pipette (mean ± SEM, t test, p = 0.00038, p = 0.00078, for WT and IP3R-RNAi flies, respectively) as derived from bump-amplitude distributions of E. E, Histograms of bump-amplitude distribution with the fitted Gaussians presented in C.
