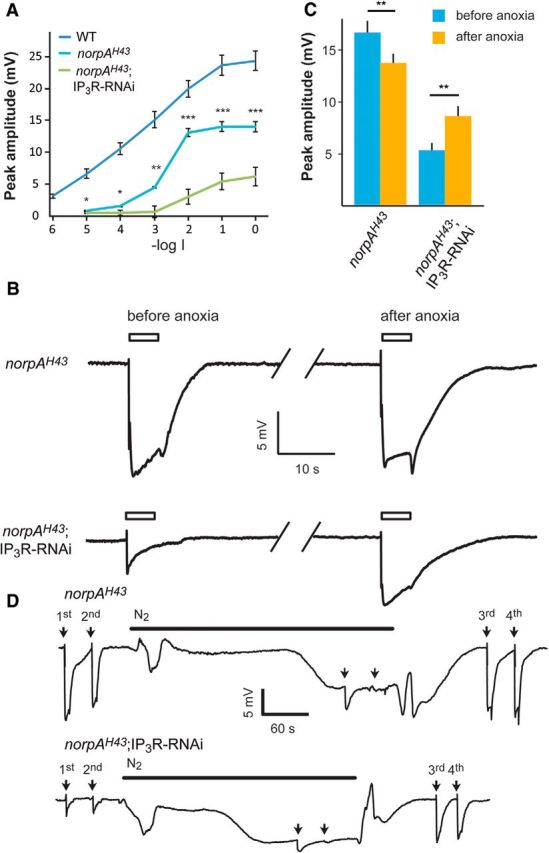
Figure 6.

Ca2+ is a limiting factor, which determines the maximal ERG amplitude when reduced IP3R levels were combined with reduced catalytic activity of PLCβ. A, Intensity–response relationship of peak ERG responses to increasing intensities of light stimulations of WT (redrawn from Fig. 2), norpAH43, and norpAH43;IP3R-RNAi flies. B, Traces of ERG recordings of norpAH43 and norpAH43;IP3R-RNAi in response to maximal intensity light pulses (open bar) before and after application of anoxia (see D below), which is known to robustly increase cellular Ca2+. C, A histogram comparing the peak amplitude of the ERG light responses of norpAH43 and norpAH43;IP3R-RNAi before and after anoxia (mean ± SEM, t test, p = 0.0014 and p = 0.00035 for norpAH43 and norpAH43;IP3R-RNAi, respectively; n = 10). D, Traces showing the entire experiments from which the ERG traces of B were taken. Traces of prolonged ERG recordings of norpAH43 (top trace) and norpAH43;IP3R-RNAi (bottom trace) in response to maximal intensity light pulses (arrows) followed by N2 application. Anoxia was obtained by blowing N2 on the intact fly as indicated by the horizontal line. The additional light pulses (3rd and 4th), tested the effects of cellular Ca2+ elevation by the anoxia on the ERG. The amplitudes of the ERG responses to the first and the third light pulses in each trace should be compared. The light pulses applied during anoxia (2 unmarked arrows) induced only very small light responses because most TRP and TRPL channels were already open by the anoxia.
