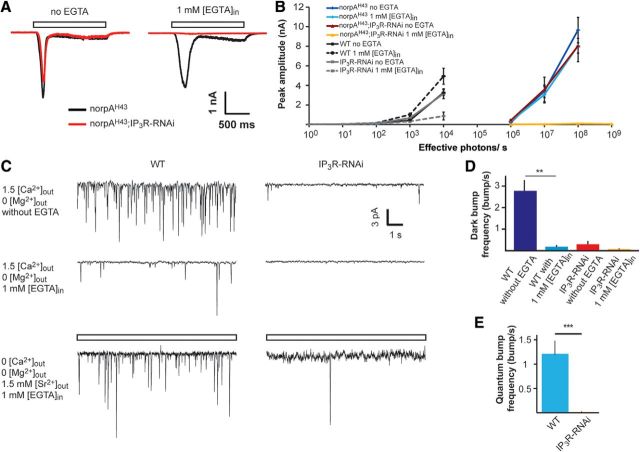
Figure 7.
Synergistic effect on the response to light between reduced IP3R level and reduced catalytic activity of PLCβ as revealed by whole-cell recordings. A, Representative traces showing whole-cell patch-clamp recordings from norpAH43 (black) and norpAH43;IP3R-RNAi (red) with and without 1 mm [EGTA] added into the standard pipette solution. B, Intensity–response relationship of norpAH43 (redrawn from Fig. 4) and norpAH43;IP3R-RNAi with and without EGTA added into the pipette as indicated. C, D, Dark-bump production was virtually abolished in IP3R-RNAi photoreceptors (C, top and middle left traces). Representative traces showing dark bumps of WT fly recorded for 1 min at 1.5 mm external [Ca2+] while Mg2+ was omitted from the bath solution. The dark bumps were recorded without (top) or with 1 mm [EGTA] (middle) in the pipette solution. The paradigm of the left traces was repeated in IP3R-RNAi fly (C, top and middle right traces). D, A histogram presenting dark-bump frequency during 1 min recordings in WT and IP3R-RNAi photoreceptors at the conditions of C (mean ± SEM, t test, p = 0.00598, n = 5; C, bottom line and E). Quantum-bump production of IP3R-RNAi photoreceptors was virtually abolished when extracellular Ca2+ was replaced by Sr2+ and Ca2+ was buffered in the intracellular pipette solution (C, bottom left). Traces showing quantum bumps of WT in response to dim light of 1.5 effective photons/s (open box) recorded for 1 min when extracellular Ca2+ was replaced by 1.5 mm [Sr2+]out, Mg2+ was omitted from the bath solution, and 1 mm [EGTA] was included in the pipette solution. Bottom right, The paradigm of the bottom left trace was repeated in IP3R-RNAi fly. E, A histogram presenting quantum-bump frequency during 1 min recordings in WT and IP3R-RNAi photoreceptors when extracellular Ca2+ was replaced by Sr2+ (mean ± SEM, t test, p = 0.00013; n = 5).

