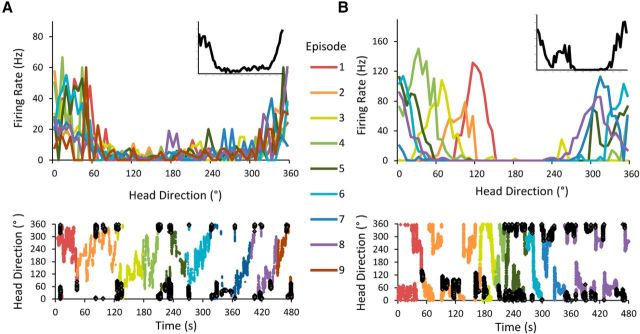
Figure 4.
Two examples of HD-like ADN cells analyzed over time. Each recording session is divided into episodes according to the animal's sampling of the environment such that each episode contains all possible headings. Top, Firing rate × HD plots for each episode. Inset, Firing rate × HD plot for the entire 8 min session. Bottom, Entire session plotted as a function of the animal's heading over time, with each episode represented by a unique color. Each dark filled point represents a time bin in which the cell had a firing rate of at least 75% of its peak firing rate. A, Stable HD cell recorded from a control animal. Note that the PFD of this cell remains consistent across all episodes. This cell's overall Rayleigh R was 0.569; the mean Rayleigh R/episode was 0.586. B, Example of a visibly unstable drifting cell that surpasses the traditional Rayleigh threshold for classification as an HD cell. The cell's PFD noticeably drifts throughout the recording session, but because its firing is still constrained to only a subset of all possible headings, its overall Rayleigh R value for the session remains >0.4. This cell's overall Rayleigh R was 0.589; the mean Rayleigh R/episode was 0.914. It is only possible to distinguish this cell from the traditional, stable HD cell by comparing its firing within individual episodes with its overall firing pattern.

