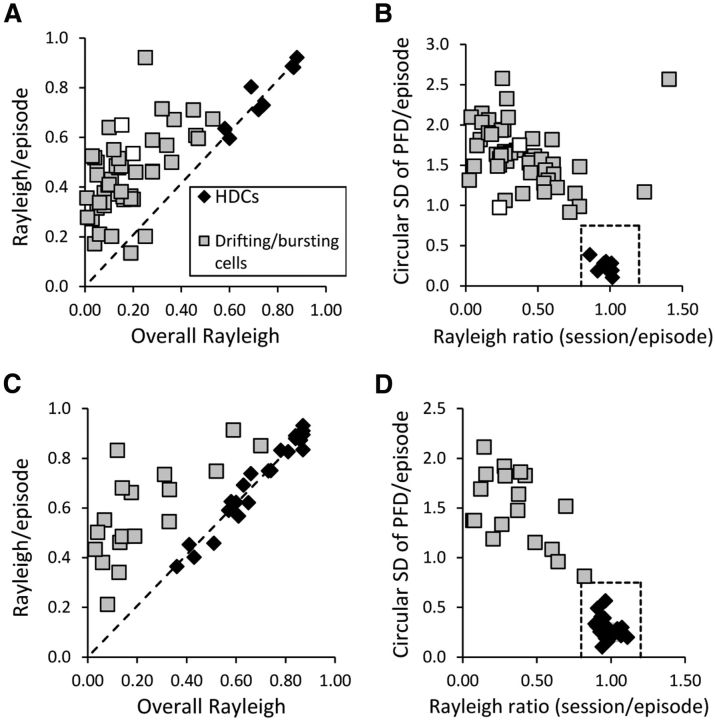
Figure 8.
Analysis of all cells from the Lesion and Partial groups that exhibited HD-like bursts of firing. A, Mean Rayleigh R value/episode plotted against the overall Rayleigh R value for the session for the Lesion group. B, PFD SD across episodes plotted against the session to episode Rayleigh R value ratio for the Lesion group. Only eight of the Lesion animals' cells (all found in one animal) fall within the range of values defined by control HD cells (dashed box); the unstable cells recorded within this animal are indicated by white boxes. In contrast to nondirectional cells in Controls seen in Figure 3, the non-HD bursting cells observed in the Lesion animals showed relatively large Rayleigh R values within their episodes, consistent with the view that their firing is not random, but rather that the network that generates the HD signal remains to some extent intact. C, Mean Rayleigh R value/episode plotted against the overall Rayleigh R value for the session for the Partial group. D, PFD SD across episodes plotted against the session to episode Rayleigh R value ratio for the Partial group. Unlike Lesion animals, a sizeable proportion of these Partial animals' bursting cells were stable HD cells (25 of 43 cells).

