
Figure 2.
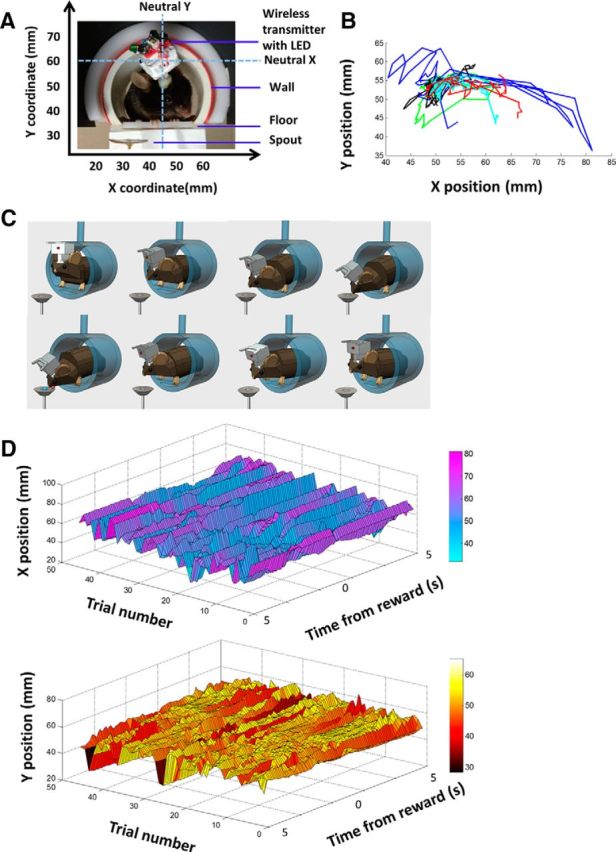
Illustration of behavioral task and wireless recording. A, Illustration of in vivo wireless multielectrode recording and the behavioral task. The mouse perches on a small platform, where it is free to move, but locomotion is not possible as the platform is elevated. On its head is a miniaturized 16-channel wireless headstage (1.5 × 1 × 1.5 cm) weighing ∼3.8 g and connected to a chronically implanted multielectrode array targeting the SNr. Sucrose solution is delivered into the spout periodically, preceded by a brief tone. Position of the LED is defined on a Cartesian plot with the ordered pair (x, y). B, Illustration of variability in movement trajectory. Each color represents position change during a single trial. C, Diagram illustration of the movement to collect sucrose from the spout. D, Representative illustration of LED position from 45 consecutive trials in a session. The x- and y-coordinates are plotted separately.