
Figure 3.
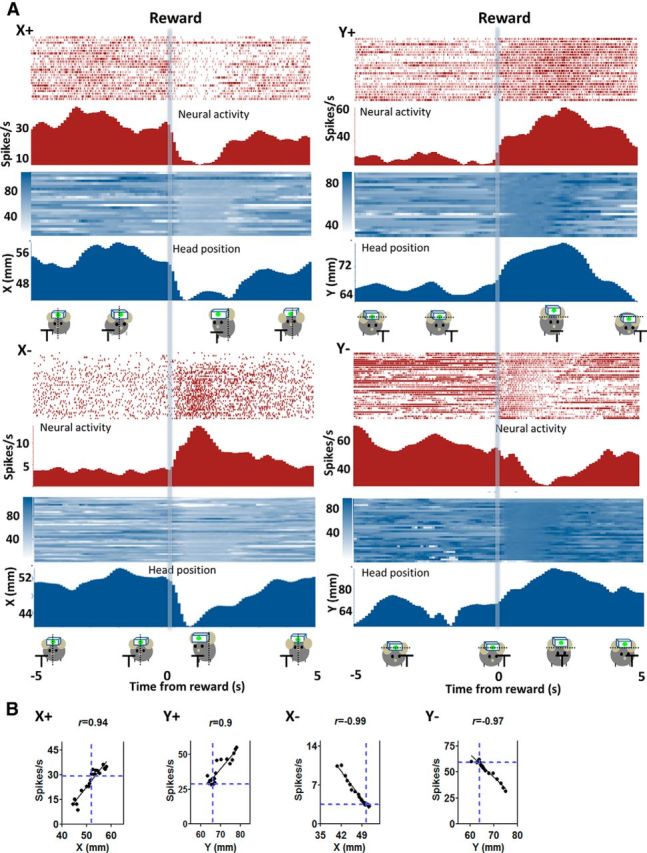
Relationship between single-unit activity from SNr and raw position coordinates during movement. A, The firing rate of SNr neurons exhibits high correlation with instantaneous position coordinates. The position is defined from the edge of the frame in the captured image. Higher x-coordinate values indicate positions to the left of the resting neutral position, whereas lower x values indicate positions to the right. Raster plot of a neuron showing a positive correlation with x-coordinates of the head position as measured by the LED (X+ neuron, p < 0.001). The mouse initiates a movement, lowering its head and moving slightly to reach the spout, where sucrose solution (10%, 13 μl) is delivered ∼2 s later (transparent blue bar). Y+ neuron, Positive correlation with y-coordinates (p < 0.001); X− neuron, negative correlation with x-coordinates (p < 0.001); Y− neuron, negative correlation with y-coordinates (p < 0.001). Relative changes in firing rate and position are shown on the right y-axis. B, Correlation between firing rate and instantaneous position coordinates.