
Figure 9.
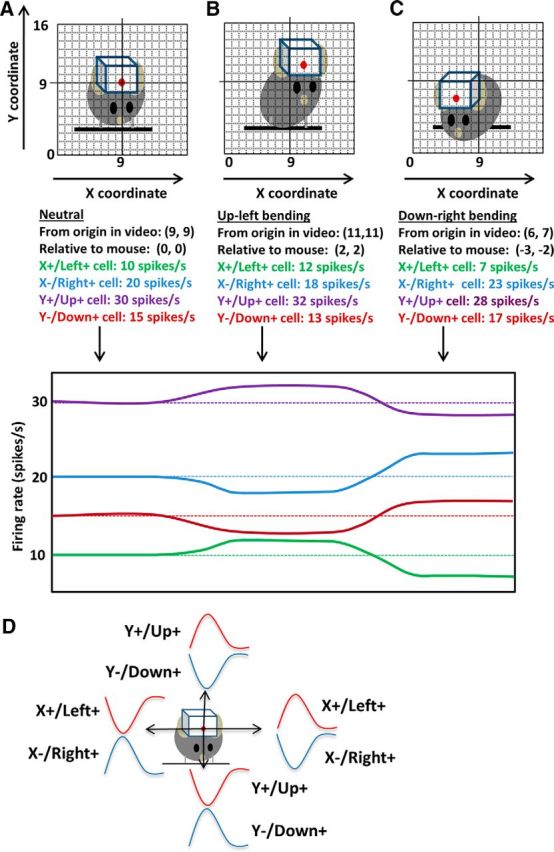
Schematic illustration of different types of neurons. A, Illustration of hypothetical mouse movement in relation to the neural activity. The firing rates of the four types of neurons are shown. For this hypothetical example, 1 spike/s is equal to 1 unit of change in x- or y-coordinate. The units are arbitrary. The starting position is (9, 9). B, The mouse moves to its left and up. The LED position changes to (11, 11). C, Right, The mouse moves to a new position (6, 7). Relative to its start position, the change is (−3, −2). D, Schematic illustration of the relationship between neural activity in relation to movements in four directions. The illustration of neural activity does not represent actual data because we did not record all four types of neurons from a single animal during a session. Opponent activity was observed during movement in any direction. For example, Y+ (Up+) neurons increase their activity during upward movements and decrease their activity during downward movements. The opposite is true of Y− (Down+) neurons.