
FIGURE 3.
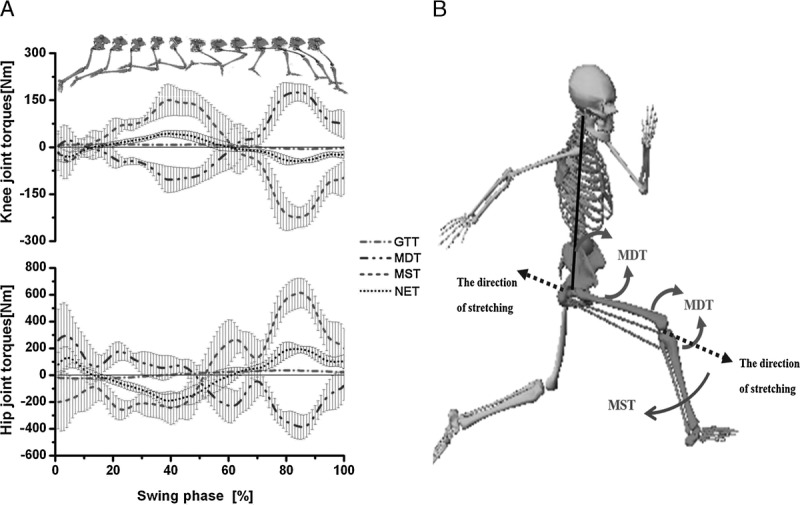
A. Averaged time-normalized graphs for joint torques at the knee and hip joints during swing phase. The top panel shows positions of the lower extremity during swing phase. Data represents the group mean (lines) with one SD (shading). B. Diagram of sprinting during the late swing phase; the inertial loads produced by segment motion work at the knee and hip joints. +, extension; −, flexion.