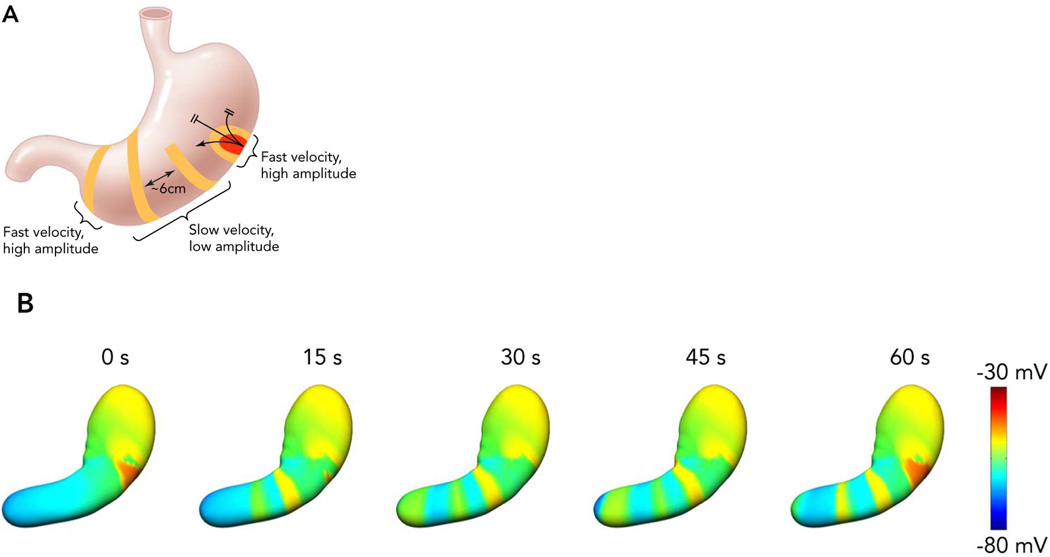
Figure 1.
The normal human gastric slow wave conduction pattern.7,13 A: Slow waves arise from a pacemaker region in the corpus at the greater curvature. Slow waves initially propagate in all directions, and rapidly in the circumferential axis, forming complete ring wavefronts in the mid corpus. Multiple wavefronts accrue, spaced ~6 cm apart, before a transition to rapid activation within the antrum. Higher amplitude signals are observed whenever conduction velocity is rapid.13 B: Simulations demonstrating this activation pattern over time13,30. Multiple wavefronts propagate as successive rings around the lumen, with each cycle taking 1 min to reach the pylorus. From Cheng LK, Du P, O’Grady G. Mapping and modeling gastrointestinal bioelectricity: from engineering bench to bedside. Physiology. 2013;28:310–317; with permission.

