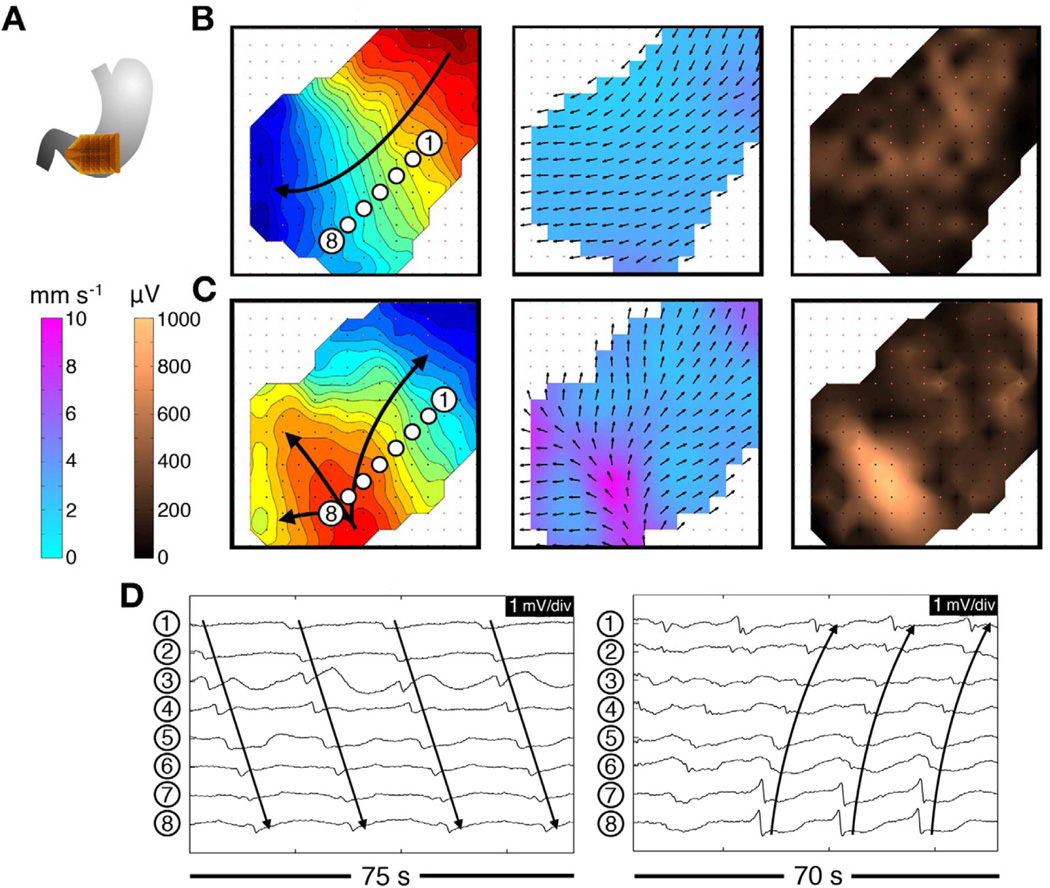
Figure 6.
An example of regular tachygastria mapping at HR in a patient with diabetic gastroparesis. Isochronal intervals = 1 second. A. Array position. B. Normal activity was initially mapped for 280 seconds (3.3 cpm); isochronal, velocity, and amplitude maps are shown. C. Regular tachygastria followed due to an ectopic pacemaker (4.0 cpm). Isochronal maps show organized retrograde propagation, with velocity and amplitude maps demonstrating the emergence of rapid circumferential propagation and associated high-amplitude potentials near the ectopic focus. D. Representative electrograms from these normal (left) and arrhythmic activities (right). From O’Grady G, Angeli T, Du P et al. Abnormal initiation and conduction of slow wave activity in gastroparesis, defined by high-resolution electrical mapping. Gastroenterology. 2012;143:589–598; with permission.

